
Getting started with Microsoft Dynamics 365 Supply Chain Center
Introduction
Microsoft Supply Chain Center is a new solution build in the Power Platform environment that support business to manage their supply chain better. It can bring supply chain data from other ERP systems, like Dynamics 365, SAP and Oracle, as well as other supply chain systems to Microsoft Dataverse. Based on this data the users can look at critical supply chain KPIs and review relevant news articles that can impact their supply chain. At the time of writing this article the Microsoft Supply Chain Center is available in public preview version. This article is about getting the first steps in the Supply Chain Center.
Get a free trial version
Microsoft offers a free 180-day trial of the Supply Chain Center. To sign up for the free trial version follow these steps:
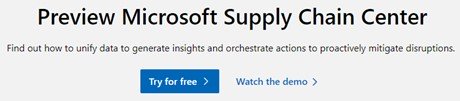
- Open the Microsoft Supply Chain Center website and use the “Try for free” button:
2. On the next page you will be asked to enter your e-mail address linked to your Microsoft account to start the trial.
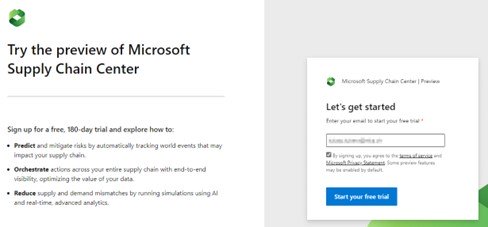
Important: A Microsoft Azure Active Director (Azure AD) tenant is needed to sign up for a trial version. In you don’t have an Azure AD tenant, you can get 1 month free by signing up for Microsoft 365 trial.
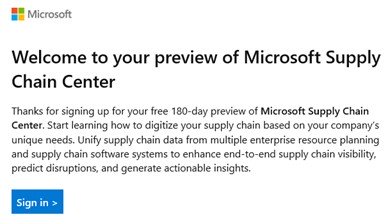
3. The trial needs a few minutes to establish a test environment. Once it’s ready, you will receive a confirmation email to the email address you provided. Click on “Sing in” to open the test environment.
First steps in Supply Chain Center
When a trail Supply Chain Center environment is created, a new Dataverse environment with sample data is also created at the same time. You can delete the sample data at any time. However, it is worth keeping it for testing purposes.
The Microsoft Supply Chain Center is made up of different modules, which are available on the navigation pane on the left. In this article I will give you short explanations about the most important of these modules.
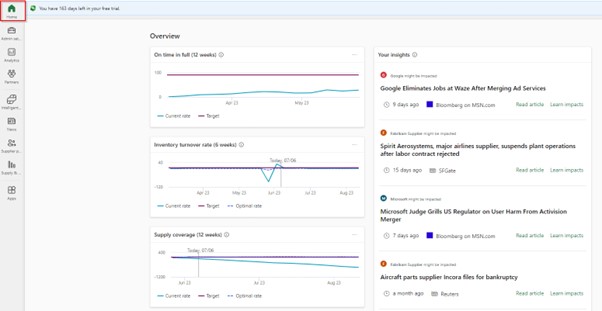
Home – shows insights and charts from “Supply and demand insight” module and news from “News” module that can be relevant to your company.
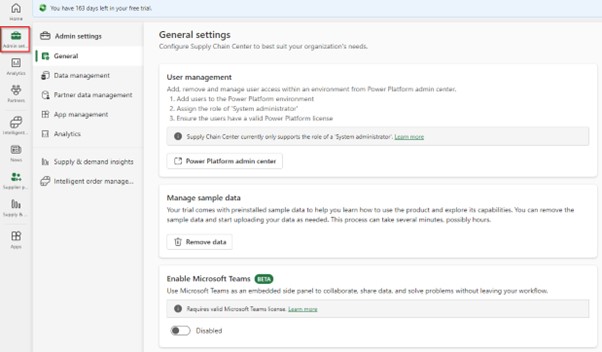
Admin settings – allows you to assign or remove access to the Supply Chain Center for other users. You can also manage the data within Supply Chain Center and enable other modules.
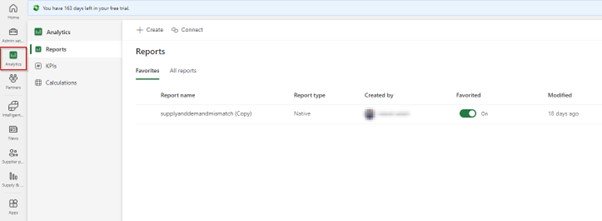
Analytics – the module allows you to create customized visualizations of supply chain data. The Supply Chain Center uses the Power BI to create reports or dashboards. You can either use the Power BI and the default reports that comes with Supply Chain Center or you can connect to your own Power BI workspace.
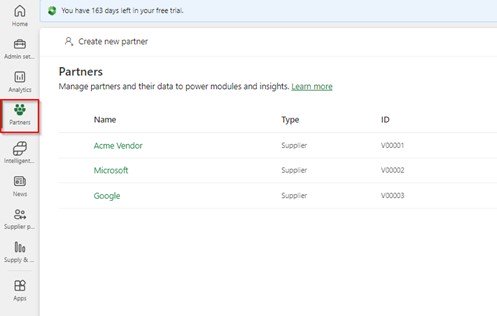
Partners – in this module you can add or create a list of partners (customers and vendors) who are involved in your supply chain. This allows the Supply Chan Center to collect the latest news about your partners and display it in the “News” module.
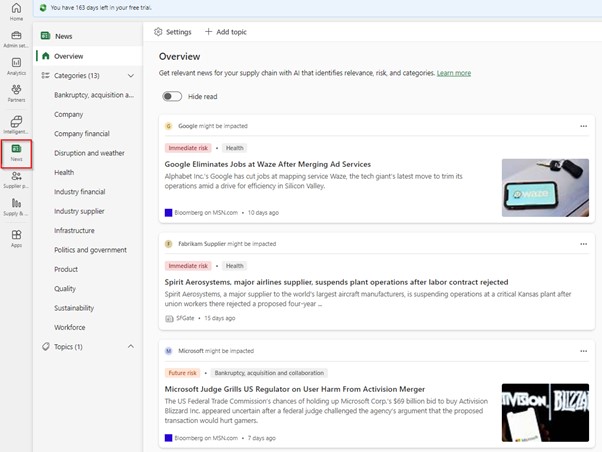
News – the module uses AI model to gather important news that could affect your supply chain. Each article is labeled with an impact score and category. The impact score is calculated by AI model by analyzing the content of the article and comparing it to historical articles. There are 3 predefined impact scores: Immediate risk, Future risk and Positive impact. Currently the only source of news is Bing News and news are available only in English.
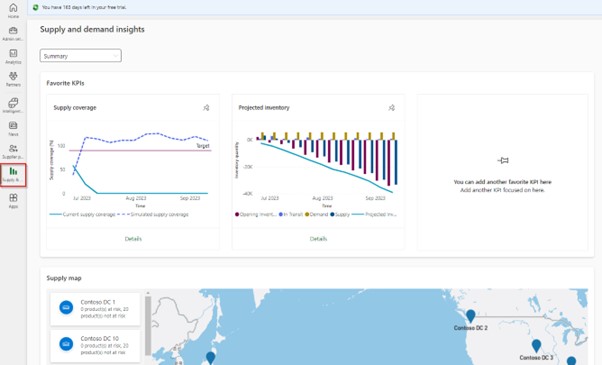
Supply and demand insights – In this module you can pin your 3 favorite KPIs to have them on one page. Currently available KPIs are:
- One time in full (OTIF) – measures how well suppliers meet their commitments to deliver order on time and complete, based on the original requested delivery date.
- Inventory turnover rate (ITR) – shows how many times the goods have been sold or consumed compared to how much was bought. It tells how many times items in inventory are replaced in a given period (usually one month). A higher ITR value indicates better inventory management. In general, an ITR value above 2 is recommended.
- Supply coverage – measures how well the supply of goods meets the demand for them. It is calculated by comparing the total supply to the total demand and expressing the result as a percentage. The higher the supply coverage percentage is, the better a company meets the customer demand.
- Commitment shortage – measures how well suppliers keep their promises or commitments. For example, if a supplier promises to deliver 100 units of a product during a week, but only 80 units were delivered, the commitment shortage will be 20% [(80/100) * 100%]. The higher the commitment shortage, the more a supplier is struggling to meet his promises. A low percentage means better commitment by a supplier.
- Projected inventory – calculates how many quantity of a product is left in stock after fulfilling the demand. It is calculated by comparing the available supply of the product (on-hand inventory + in-transit shipments) to the confirmed customer orders for it. For example, a company has 200 units of a product in stock (on-hand inventory) and another 50 units on the way (in-transit shipment). A customer places an order for 180 units. The projected inventory will be 70 units [(200+50)-180]. It means that a company has 70 units of a product left over after fulfilling all the customer demand. If the projected inventory is positive, it means that a company has more product than needed, which might result in excess stock. On the other hand, if the projected inventory is negative, it means that a company doesn’t have enough stock to meet the demand, and it could lead to stockout.
- Planning shortage – calculates the difference between the planned inventory and the actual visibility, expressed as a percentage. This helps companies assess the accuracy and effectiveness of their planning process. If there is a high planning shortage percentage, it indicates that the planning process needs improvement to better match inventory levels with the projected demand. On the other hand, a low or negative planning shortage shows efficient planning, where inventory closely aligns with the anticipated requirements.
- Purchase order fill rate – calculates the ratio of the total quantity of products the supplier actually delivered to a company compared to the total quantity of products a company ordered from the supplier. A high purchase order fill rate means that a supplier better meets the demand. On the other hand, a low purchase order fill rate may indicate that the supplier is facing difficulties in keeping up with demand and it could result in delayed orders.
- Purchase order commitment rate performance – shows the percentage of purchase orders that the supplier commits to deliver within a specific time frame. For example, a company places 100 orders with a supplier, and the supplier commits to deliver 90% of those orders within a promised time frame. The purchase order commitment rate would be 90%.
- Purchase order return rate – measures the percentage of orders that are returned to suppliers after purchase. A high return rate can indicate problems with the product's quality or with the order process. On the other hand, a low return rate means that the supplier's products meet higher standards of quality and consistency.
- Weeks of supply – measures how long a product inventory lasts before it must be replenished. For example, if a company has 500 units of a product in stock and consumes 50 units per week on average, it has 10 weeks of supply (500 units / 50 units per week). In this case, the company can continue to operate for 10 weeks before it must replenish its inventory to avoid stockouts or delays in customer order fulfillment.
- Purchase order cycle time – measures how many days it takes for a purchase order to be processed from the moment it's requested until the goods or services are delivered by the supplier to the customer.
- Purchase order transit time – measures many days it takes for a purchase order to be delivered from the moment it's placed until it reaches the buyer's location.
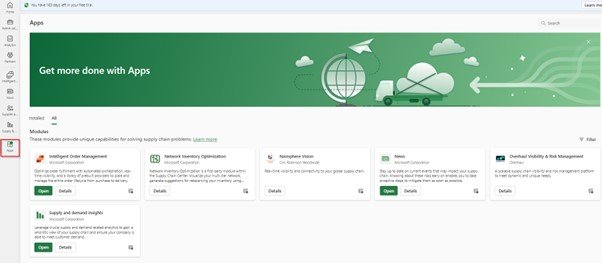
Apps – in this module you can turn on extra modules to expand the Supply Chain Center capabilities. The modules are provided by Microsoft, and they are activated by default. The other modules are created by independent software vendors (ISVs) and can be activated once you purchase a license.
Conclusion
The real benefit of Supply Chain Center is that the supply chain data from different systems can be consolidated and analyzed in one location. For this reason, this solution is more suitable for large companies whose data is spread across several systems.
As mentioned, this solution is still in preview phase and there are more new features planned for the future. This includes for example integration with Microsoft Teams or collaboration with suppliers and customers. A complete release plan can be found here.
Add new comment