
Description
Interactive Dashboards have been released with Microsoft Dynamics 365 V9. Interactive Dashboards are like the regular dashboards in Dynamics 365, but with some improvements like field-filters, time-spanning filters, real-time data updates, count-aggregates and integrated quick actions for records.
Interactive Dashboards can be global or entity-specific. There are two kinds of dashboards: Single-Stream and Multi-Stream. A Stream is another name for a View – a list of records linked to a specific entity. The streams/visualizations are interactive. Meaning that a click on a visualization will reflect to the other charts and streams.
In a Single-Stream Interactive Dashboard, the stream is displayed on the left of the dashboard (red rectangle). In the middle, there are several charts created by system customizers (blue rectangle) and aggregated counts are displayed on the right (green rectangle). The aggregate count – named Tile View – are based on other streams selected by the dashboard creator.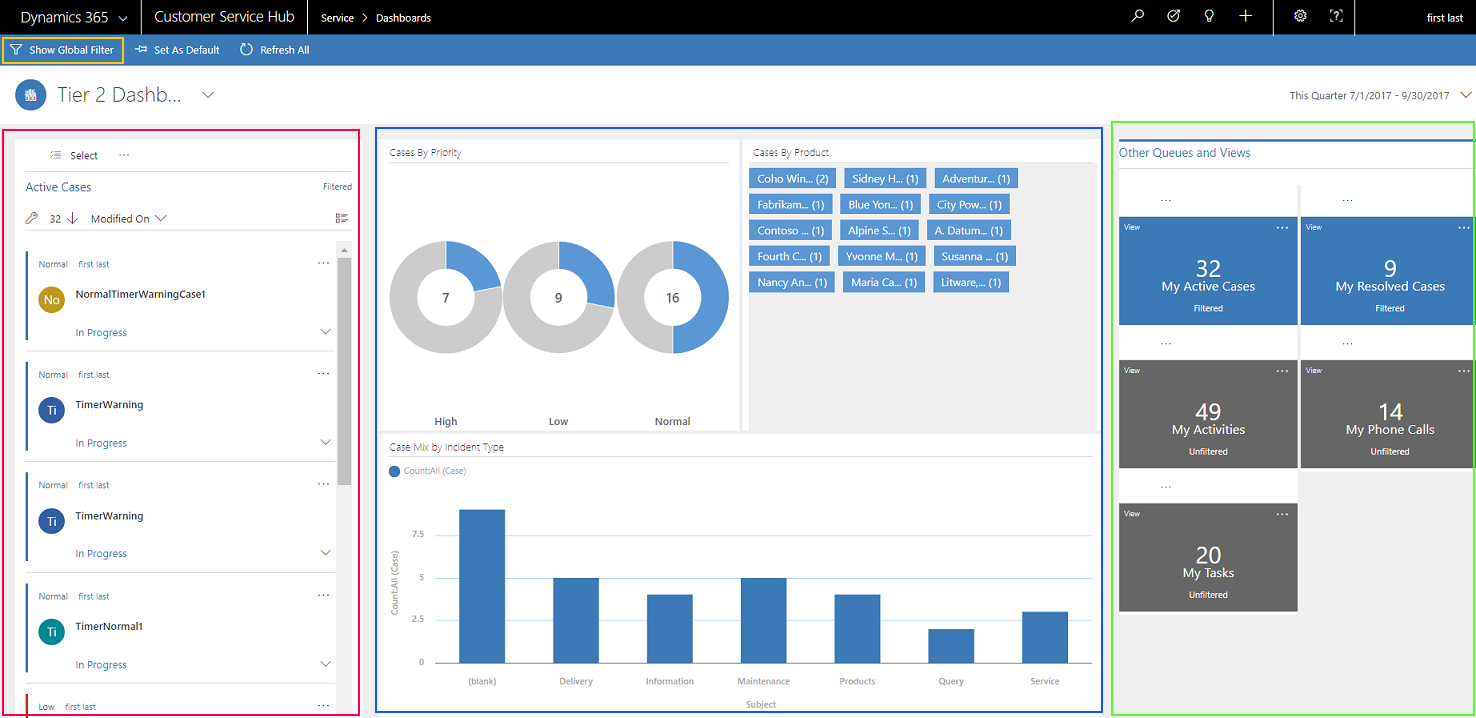
On the ribbon above the Dashboard title is displayed the Show Global Filter button (yellow rectangle). This enables users to filter records based on some selected fields from the entity. Once filters are applied, the records displayed in the stream will be automatically updated: the charts and tile view will reflect those changes.
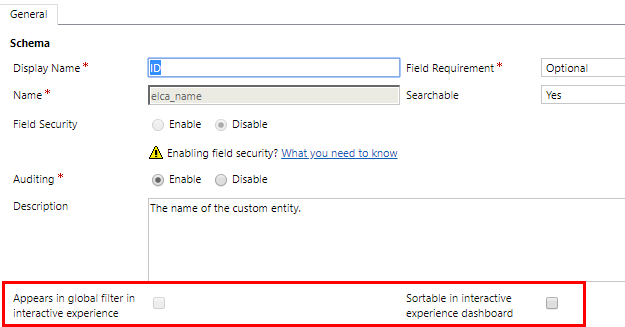
Fields need to be configured to act as filters in Interactive Dashboards:
Multi-Stream Interactive Dashboards follow the same logic as single-stream ones. The difference is that there are more streams to display. Therefore, the Tile View is hidden – replaced by a button, the streams are displayed on the bottom of the dashboard and the charts – or Visual Filter – above the streams. A click on one of the charts will drill-down the data and create a new filter.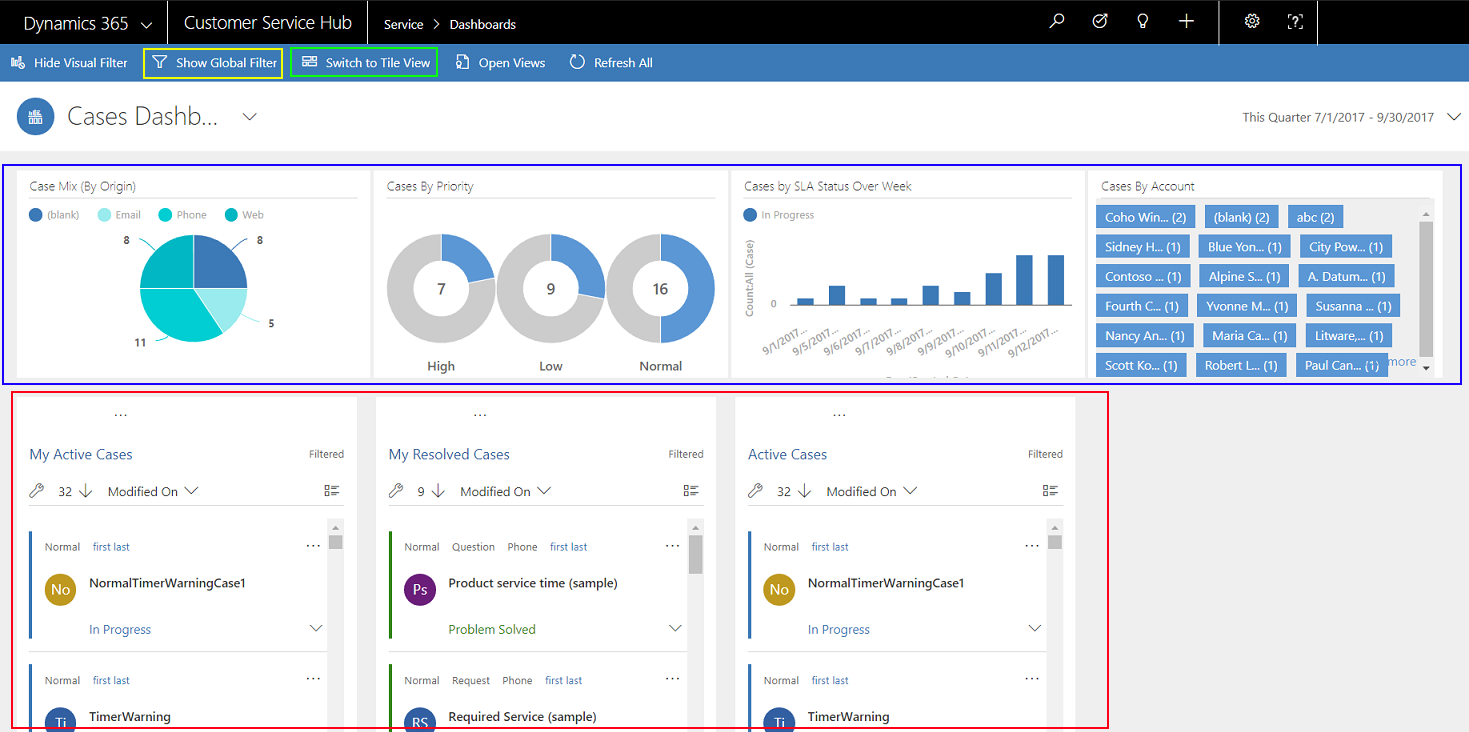
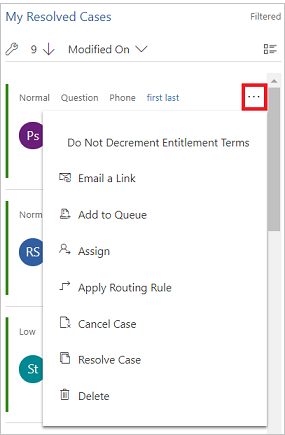
On each record in a stream there is the Quick Action menu to enable users to take work with record directly from the dashboard.
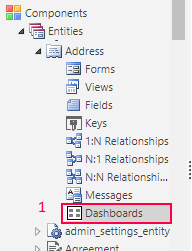
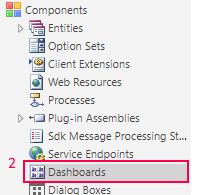
An Interactive Dashboard can be created from the Customization center of Dynamics 365. Either directly associated with an entity (rectangle 1) or within the Dashboards component (rectangle 2).
 |
 |
Take-away points
- Enable to have a more effective visualization of data and interact with it.
- Filters, aggregate counts, real-time data update on the dashboard streams and visualizations.
- Work as a regular dashboard in term of security.
Links to documentations

Add new comment