
Dynamics 365 Table Dashboards : You probably all know dashboards within Dynamics 365. Introducing the interactive dashboards back in the days, Microsoft set the basis for creating Dashboards on table level.
Creating a new dashboard
Creating a new one, is fairly simple:
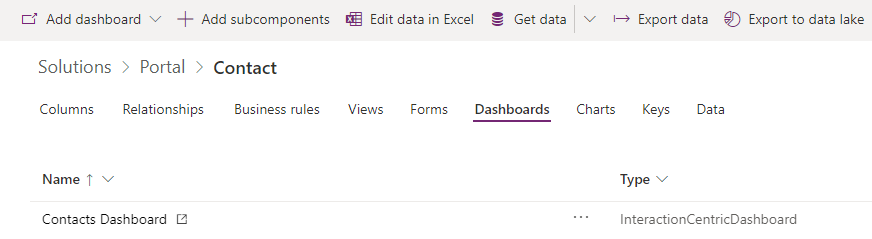
- Within a solution, open your table
- Click on "Dashboards"
- Create a new dashboard or edit an existing one
Dashboard configuration
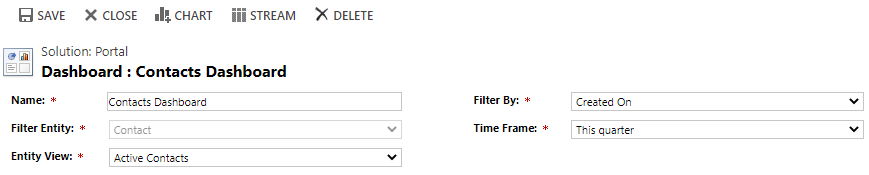
In the top section of the dashboard, you can configure the following:
- Name: Display name of the dashboard.
- Entity View: Is only used for preview.
- Filter By: Table dashboards have a time frame. This column will be used for filtering. Users can't change this.
- Time Frame: Default time frame. Users can change this.
Visual Filters
The first section after the configuration contains the visual filters for the dashboard. Here you can add charts defined earlier for the specific table.

Streams
You can add multiple streams representing a predefined view.

How does it look like for the users?
Well, in the list of rows, the user first has to select the dashboard view by selecting the following button. It can occur, that the button will be visible under the "more" commands:

| Description | |
|---|---|
| 1 | Hide or show visual filters (first section) |
| 2 | Hide or show global filters You can prefilter the whole dashboard and save those filters 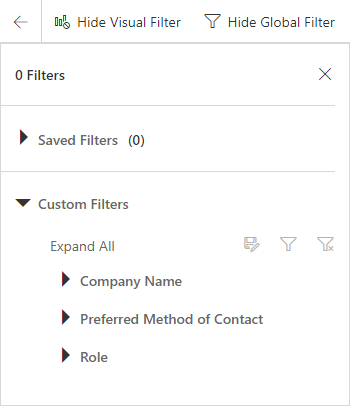 |
| 3 | Switch to tile or stream view. In tile view, the streams (lists of rows) will be changed to a tile, which summarizes the stream.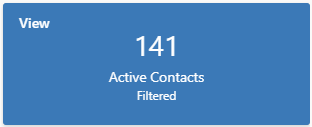 |
| 4 | Switch back to table list view |
| 5 | Change timeframe of the rows displayed. You can choose from predefined timeframes or select your own.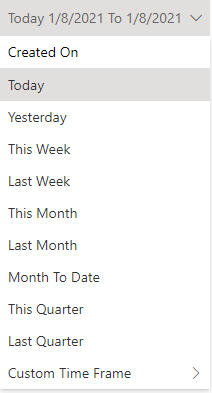 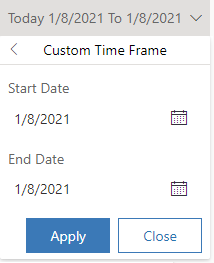 |
Dynamics 365 Table Dashboards

Fabian Kalchofner
I’ve started working with Dynamics 365 from 2015 after graduating from the FHNW in Business Information Systems. I made it through all the versions from 4.0 up to the latest one and can’t wait to see, where it’s going with my favorite topics Omnichannel, Portals, and Flows. With a lot of experiences in developing, customizing, configuring, and deploying CRM solutions, I’ll try to share my knowledge back to the community.