
Dataverse Plugin telemetry with Azure Application Insights:
Introduction
Troubleshooting a piece of code is probably one of the main task in software development. With good logs, you can understand what happened and the code behavior. This is even more accurate for a CRMs and Microsoft Dataverse, where non-IT users are working with the CRM all day long.
In Dataverse and Dynamics 365, tracing has been the way to record run-time information and assist us to diagnose behaviors. Trace logs are written directly to a Dataverse table - PluginTraceLog - and triggered by a trace system settings (off, on or only for exceptions). These logs must be written specifically by the developer in the C# code. An example of such code is given below in the Plug-in Tracing via Trace section.
In July 2021, Microsoft has announced a public preview version to have plug-in trace logs in Application Insights. Application Insights is a feature from the Azure world used to monitor and capture all enterprise activities. The data is collected into Azure Monitor and is used for performance diagnostics, alerts, visualizations, failures reviews and many more. You can created dashboard, enabled Smart Detection or even create you custom queries to asses the system's health. Microsoft describes in more detail the benefits of such tool. Combining this with other tools like the model-driven app monitoring give a full picture of the plateform's health.
With this integration, there are no SDK or other work needed from the developers, everything is already set up and ready to use with the ILogger interface.
Set up insights
To set up the integration, the first thing to do is to create an Application Insights resource in Azure. This is very simple to do:
- Log in the Azure portal
- Create a new resource
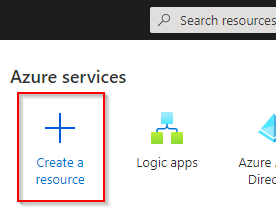
- Search for Application Insights and click Create
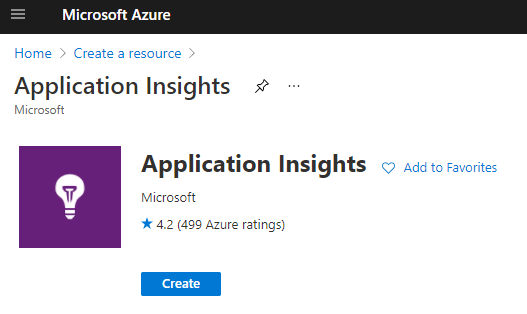
- Fill the fields and create the new resource
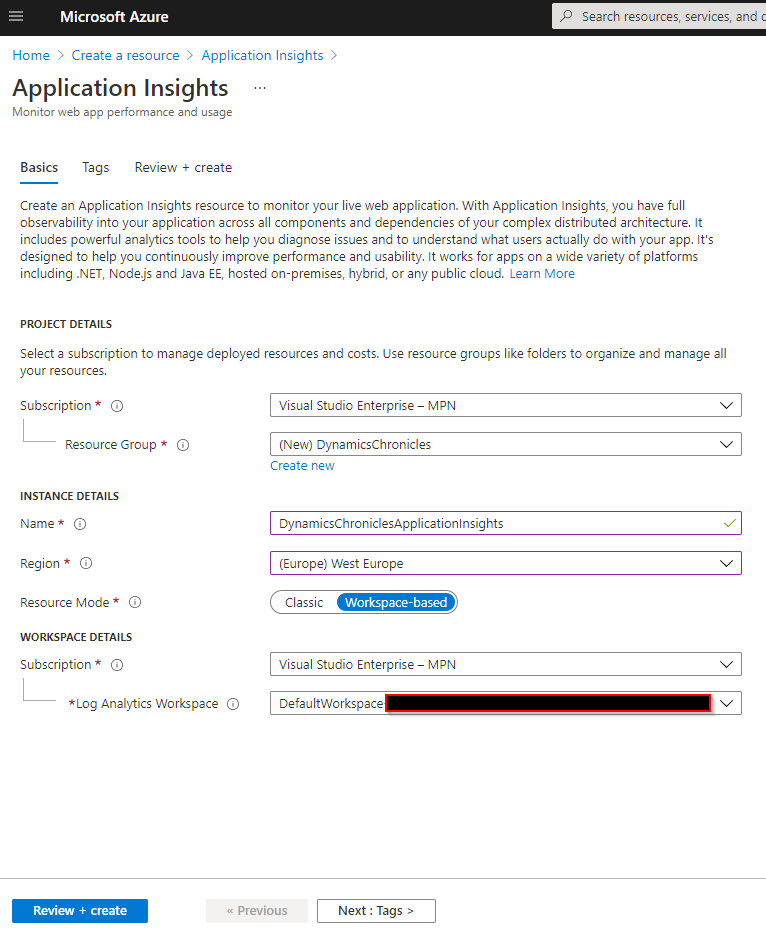
- Note that you must have at least one of the following rights on this resource: contributor, writer, or admin.
Once the Azure resource has been created, you need to go to the Power Platform admin center:
- On the right panel, select Analytics > Data export
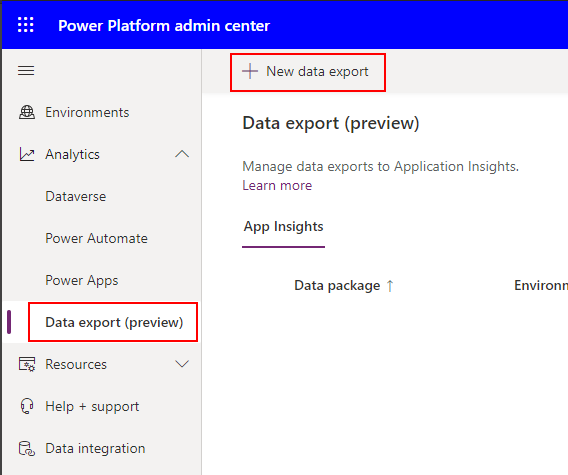
- Click on the button New data export and select the desired environment
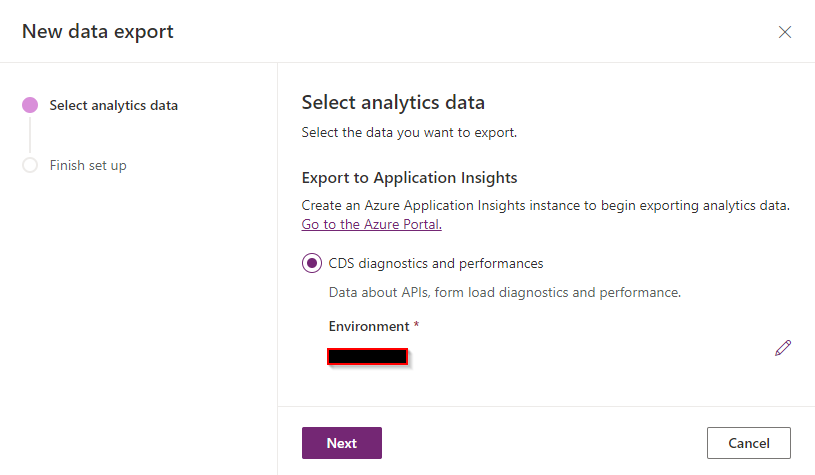
- Click Next
- Select the Application Insights resource newly created
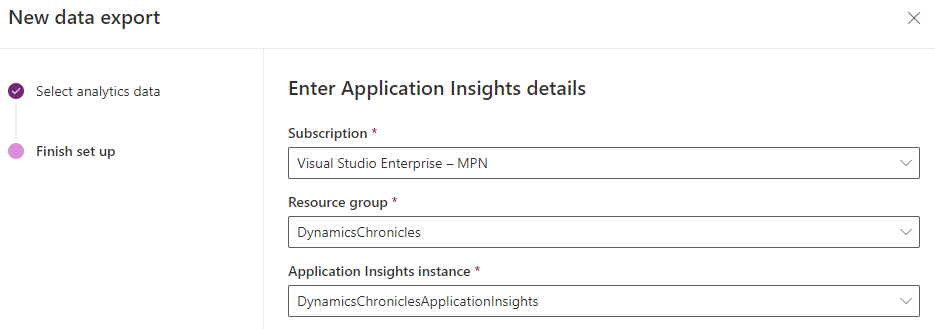
- Click Create
And that's it! Nothing more to do.
If for whatever reason you decided to not use the Application Insights telemetry, simply deleting the Data export will do the trick.
Telemetry with Application Insights
With this new integration, all logs a developer writes within the ILogger interface from the Organization Service SDK are available in the Application Insights resources specified, without the need to code anything more! Under the hood, Dataverse will receive the logs and send it to the Application Insight resource, meaning that some delay might be experienced before the telemetry is visible in Azure.
Let's build a plug-in that makes usage of the ILogger interface. Please check below on the section Plug-in Tracing via Trace on how to register and trigger this plug-in.
using System;
using System.ServiceModel;
using Microsoft.Xrm.Sdk;
using Microsoft.Xrm.Sdk.PluginTelemetry;

namespace DynamicsChroniclesPlugins
{
    public class FollowUpMeetingPlugin : IPlugin
    {
        public void Execute(IServiceProvider serviceProvider)
        {
            // Obtain the ILogger service
            ILogger logger = (ILogger)serviceProvider.GetService(typeof(ILogger));

            // Obtain the execution context from the service provider.
            IPluginExecutionContext context = (IPluginExecutionContext) serviceProvider.GetService(typeof(IPluginExecutionContext));

            // The InputParameters collection contains all the data passed in the message request.
            if (context.InputParameters.Contains("Target") && context.InputParameters["Target"] is Entity)
            {
                // Obtain the target entity from the input parameters.
                Entity entity = (Entity)context.InputParameters["Target"];

                // Obtain the organization service reference which you will need for web service calls.
                IOrganizationServiceFactory serviceFactory = (IOrganizationServiceFactory)serviceProvider.GetService(typeof(IOrganizationServiceFactory));
                IOrganizationService service = serviceFactory.CreateOrganizationService(context.UserId);

                try
                {
                    using (logger.BeginScope("Init phase"))
                    {
                        logger.LogInformation("FollowupPlugin: Begin the plugin.");

                        if (entity.Id == null || entity.Id.Equals(Guid.Empty))
                        {
                            logger.LogWarning("Plug-in registered for a wrong entity {0}", entity.LogicalName);
                        }
                    }

                    // Create a task activity to follow up with the account customer in 7 days.
                    using (logger.BeginScope("CreateTask"))
                    {
                        Entity followup = new Entity("task");

                        logger.LogInformation("FollowupPlugin: Building Task record...");
                        followup["subject"] = "Send e-mail to the new customer.";
                        followup["description"] = "Follow up with the customer. Check if there are any new issues that need resolution.";
                        followup["scheduledstart"] = DateTime.Now.AddDays(7);
                        followup["scheduledend"] = DateTime.Now.AddDays(7);
                        followup["category"] = context.PrimaryEntityName;
                        followup["regardingobjectid"] = new EntityReference(entity.LogicalName, entity.Id);


                        // Create the task in Microsoft Dynamics CRM.
                        logger.LogInformation("FollowupPlugin: Creating the task activity.");
                        Guid taskId = service.Create(followup);
                        logger.LogInformation($"FollowupPlugin: Task created with GUID = {taskId}");
                    }
                }

                catch (FaultException<OrganizationServiceFault> ex)
                {
                    throw new InvalidPluginExecutionException("An error occurred in FollowUpPlugin.", ex);
                }

                catch (Exception ex)
                {
                    logger.LogError(ex, "FollowUpPlugin failed");
                    throw;
                }
            }
        }
    }
}
Application Insights Logs
Once the plug-in is registered and triggered, you can go to the Application Insights Logs console. On the portal.azure.com, you can open the Application Insights resource.
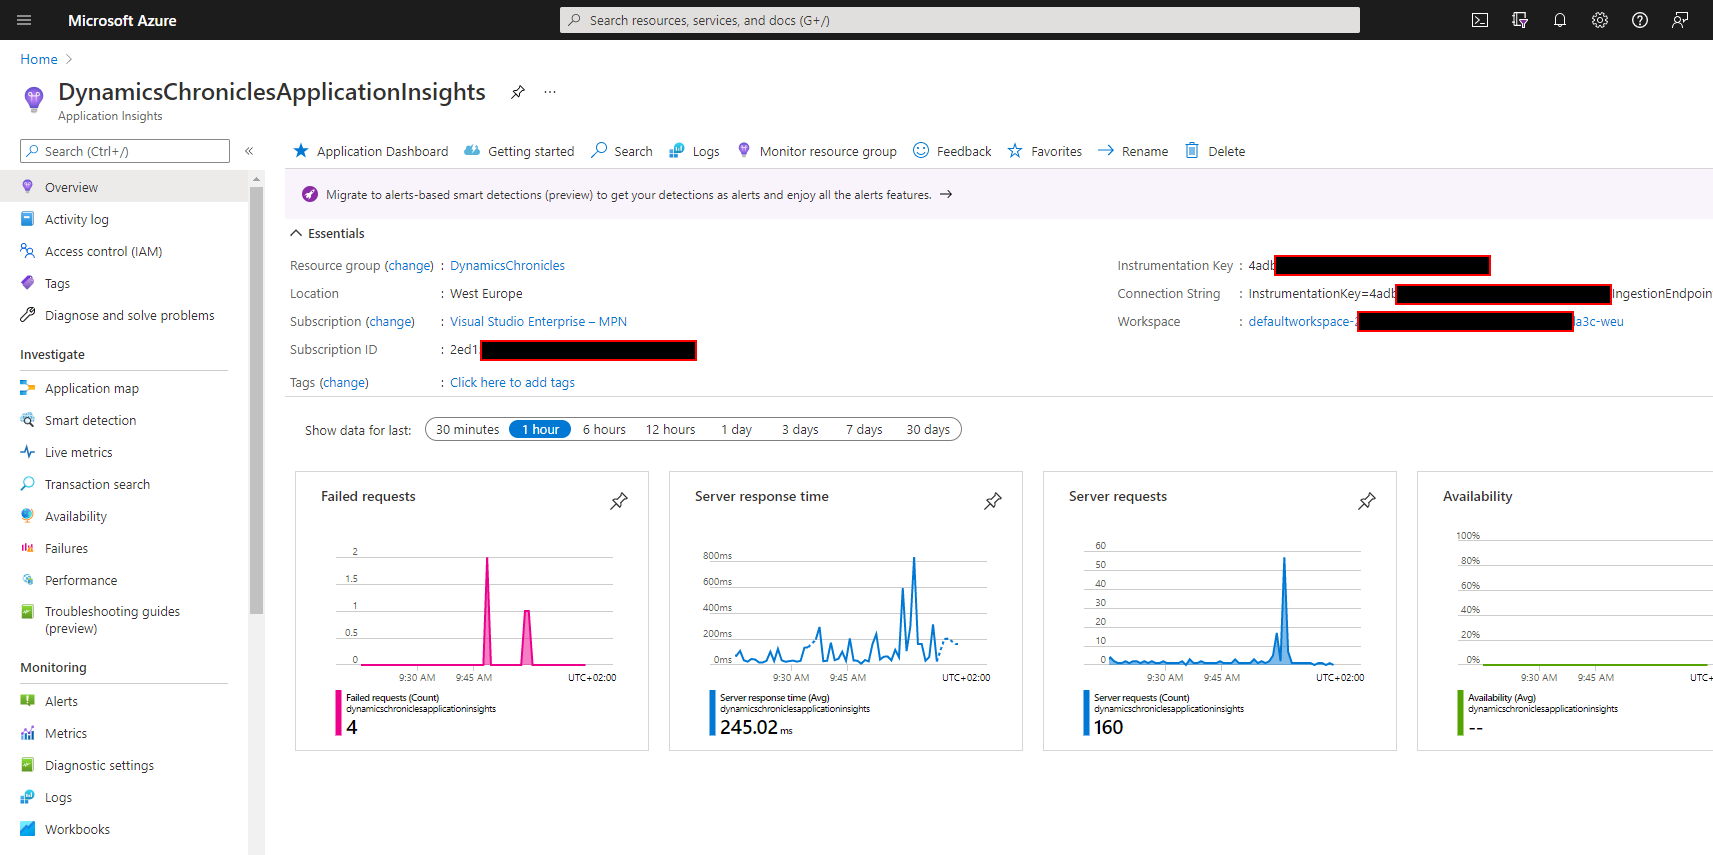
Then to see the telemetry, open the button Logs on the right panel, under the Monitoring section.
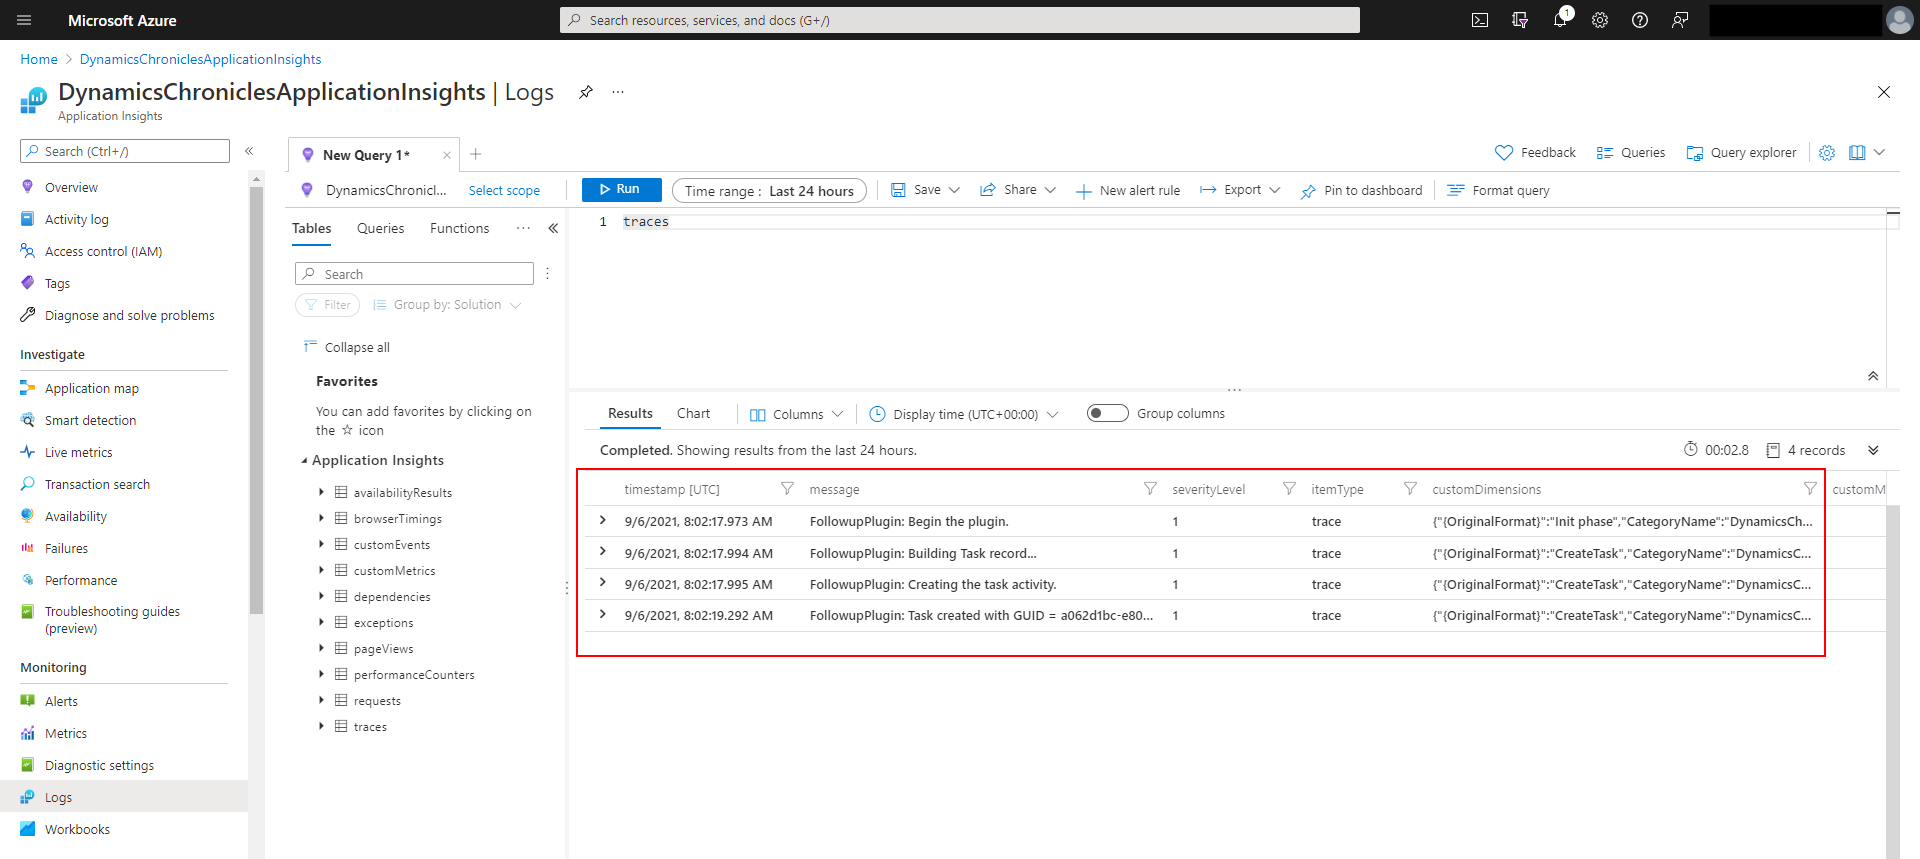
In the traces table of the Application Insights, all logs can be found. In the above image, you can see the 4 logs entry.
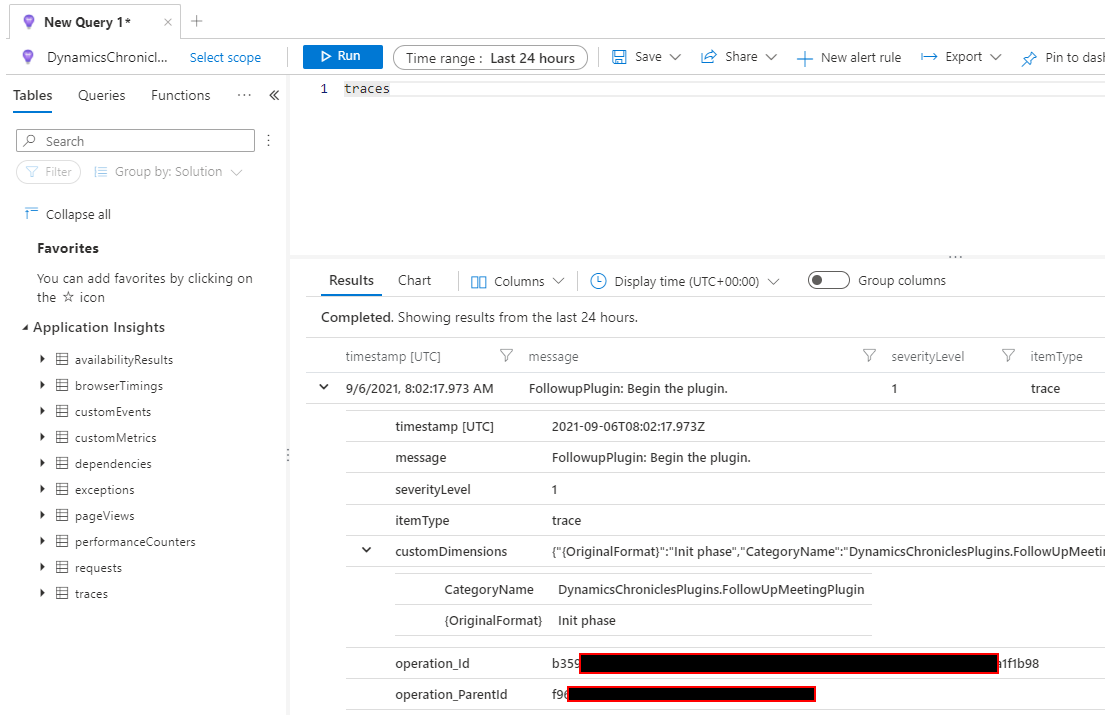
In the trace, all information is stored, from the message to the scope - or customDimensions and OriginalFormat - and the timestamp.
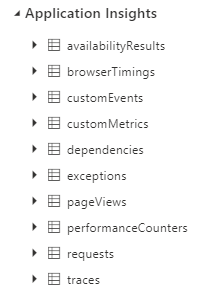
Application Insights Tables
The traces table is not the only one that can be queried. In total, there are 10 tables
- availabilityResults
- Summary data from availability tests
- browserTimings
- Data about client performance, such as the time taken to process the incoming data
- customEvents
- Custom events created by your application
- customMetrics
- Custom metrics created by your application
- dependencies
- Calls from the application to other components (including external components) recorded via TrackDependency() - for example, calls to REST API, database or a file system
- exceptions
- Exceptions thrown by the application runtime, captures both server side and client-side (browsers) exceptions
- pageViews
- Data about each website view with browser information
- performanceCounters
- Performance measurements from the compute resources supporting the application, for example, Windows performance counters
- requests
- Requests received by your application. For example, a separate request record is logged for each HTTP request that your web app receives
- traces
- Detailed logs (traces) emitted through application code/logging frameworks recorded via TrackTrace()
This page from the Microsoft's documentation also holds some information about the data model used by Azure Application Insights.
Plug-in Tracing via Trace
The normal way of having some logs from your plug-in developments is by using Trace Logs. When writing a C# class that implements the IPlugin interface, you can obtain a ITracingService object. This object allows you to write Trace Logs and then consult them directly from Dynamics 365!
Let's build such plug-in. Based on Microsoft's documentation, the following code has been created:
using System;
using System.ServiceModel;
using Microsoft.Xrm.Sdk;

namespace DynamicsChroniclesPlugins
{
    public class FollowUpMeetingPlugin : IPlugin
    {
        public void Execute(IServiceProvider serviceProvider)
        {
            // Obtain the tracing service
            ITracingService tracingService = (ITracingService)serviceProvider.GetService(typeof(ITracingService));

            // Obtain the execution context from the service provider.
            IPluginExecutionContext context = (IPluginExecutionContext) serviceProvider.GetService(typeof(IPluginExecutionContext));

            // The InputParameters collection contains all the data passed in the message request.
            if (context.InputParameters.Contains("Target") && context.InputParameters["Target"] is Entity)
            {
                // Obtain the target entity from the input parameters.
                Entity entity = (Entity)context.InputParameters["Target"];

                // Obtain the organization service reference which you will need for web service calls.
                IOrganizationServiceFactory serviceFactory = (IOrganizationServiceFactory)serviceProvider.GetService(typeof(IOrganizationServiceFactory));
                IOrganizationService service = serviceFactory.CreateOrganizationService(context.UserId);

                try
                {
                    tracingService.Trace("FollowupPlugin: Begin the plugin.");

                    // Create a task activity to follow up with the account customer in 7 days.
                    Entity followup = new Entity("task");

                    tracingService.Trace("FollowupPlugin: Building Task record...");
                    followup["subject"] = "Send e-mail to the new customer.";
                    followup["description"] = "Follow up with the customer. Check if there are any new issues that need resolution.";
                    followup["scheduledstart"] = DateTime.Now.AddDays(7);
                    followup["scheduledend"] = DateTime.Now.AddDays(7);
                    followup["category"] = context.PrimaryEntityName;
                    followup["regardingobjectid"] = new EntityReference(entity.LogicalName, entity.Id);


                    // Create the task in Microsoft Dynamics CRM.
                    tracingService.Trace("FollowupPlugin: Creating the task activity.");
                    Guid taskId = service.Create(followup);
                    tracingService.Trace($"FollowupPlugin: Task created with GUID = {taskId}");
                }

                catch (FaultException<OrganizationServiceFault> ex)
                {
                    throw new InvalidPluginExecutionException("An error occurred in FollowUpPlugin.", ex);
                }

                catch (Exception ex)
                {
                    tracingService.Trace("FollowUpPlugin: {0}", ex.ToString());
                    throw;
                }
            }
        }
    }
}
The plug-in is very simple an only creates a Task for a contact, seven days from now. Then, it has been registered with a step on the Contact entity, with the Update event, and with a filtering attribute.
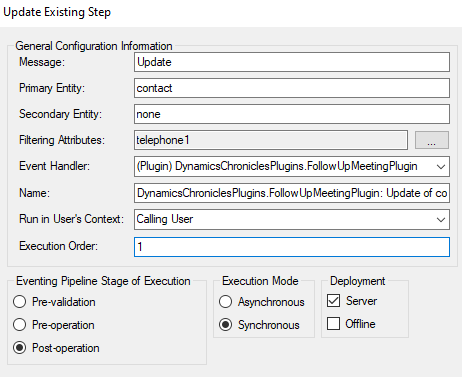
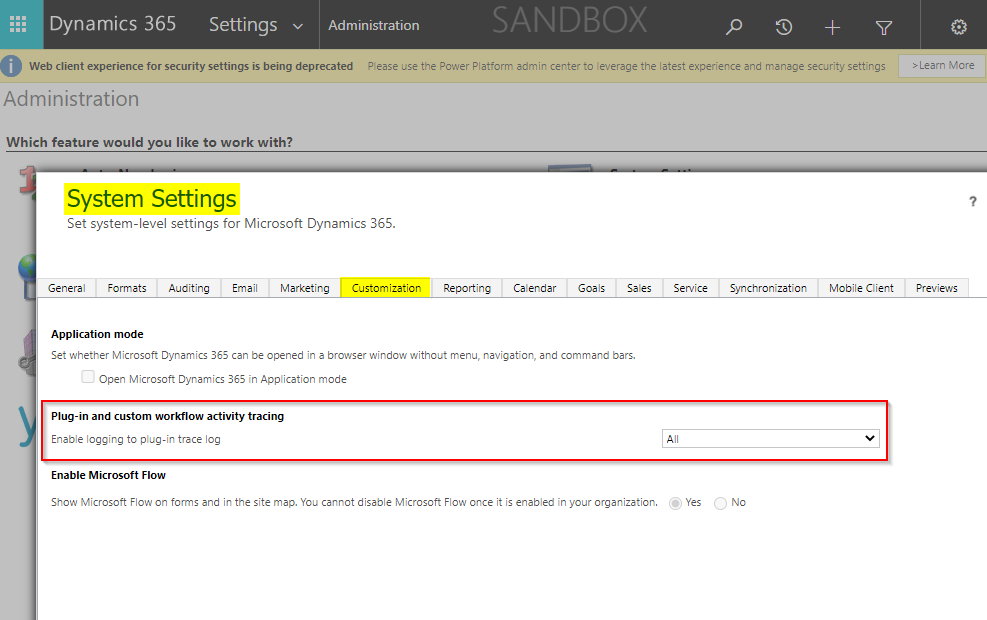
The last configuration is to enable the plug-in trace logs enabled for all events.
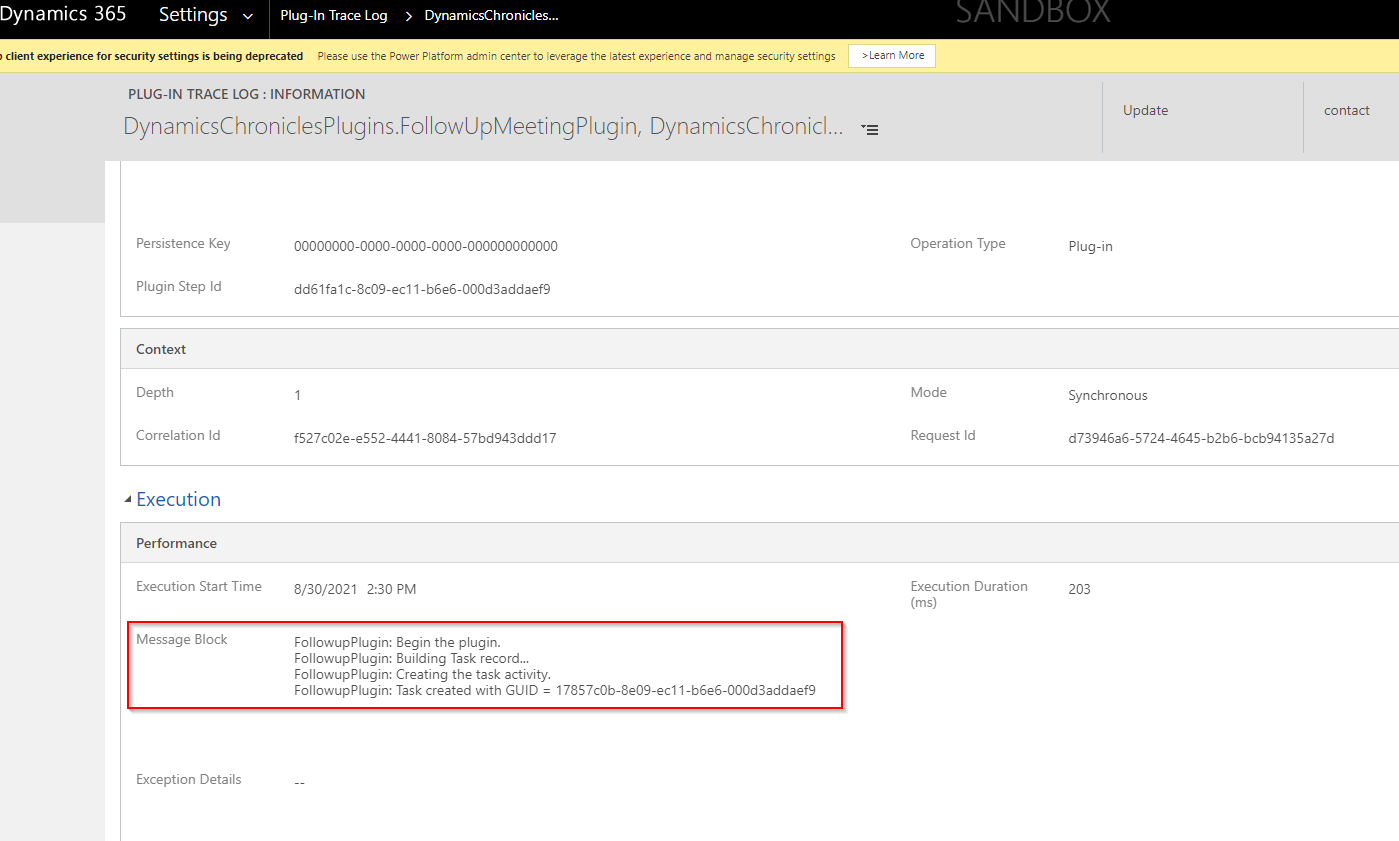
And voilà! Now when a Contact record is updated, the complete Trace Log can be find in Dynamics:
- Under Settings > Customization > Plug-In Trace Log
- Select a record with the name as in your plug-in assembly
- Search for the Message Block field
Differences between ILogger and ITracing Service
The following tables comes directly from Microsoft's documentation. It is quite interesting because it states the core differences between those different approached of logs.
| Criteria | ILogger for Application Insights | ITracingService Trace for Plug-in Trace Logs |
|---|---|---|
| Intended use | Capture telemetry over time for analysis and debugging. | While developing and debugging plug-ins |
| How long data is stored | According to your Application Insights data retention period, which is 90 days by default | 24 hours |
| Available | Only for organizations that have subscribed to Application Insights integration. | For any organization when Plug-in tracing is enabled. |
| Amount of data | Each log message can pass a String value. | Only 10kb of text can be written for each plug-in execution. Any more will be truncated. |
| Available in runtime errors | No | Available in model-driven app client errors and as annotations in Web API. |
One key difference is the retention period. Traditional plug-in trace logs are only available for 24 hours. That can be painful when an user experiences a bug, but only brings it up too late or cannot reproduce it. That one of the huge advantage of using telemetry via Application Insights.
The key advantage of the ILogger is to integrate the traditional plug-ins logs within a much bigger scope of telemetry information. In addition to the logs written by the developer, Application Insights also stores when was the code triggered, how long did it run and give some information about external HTTP requests.
Please note that you don't need to choose one or other: plug-in tracing logs and telemetry can work together! For example, if you're building an ISV product, some clients my have Application Insights enabled, some other may not. By having both options, everyone with happy :)
Application Insights Tools
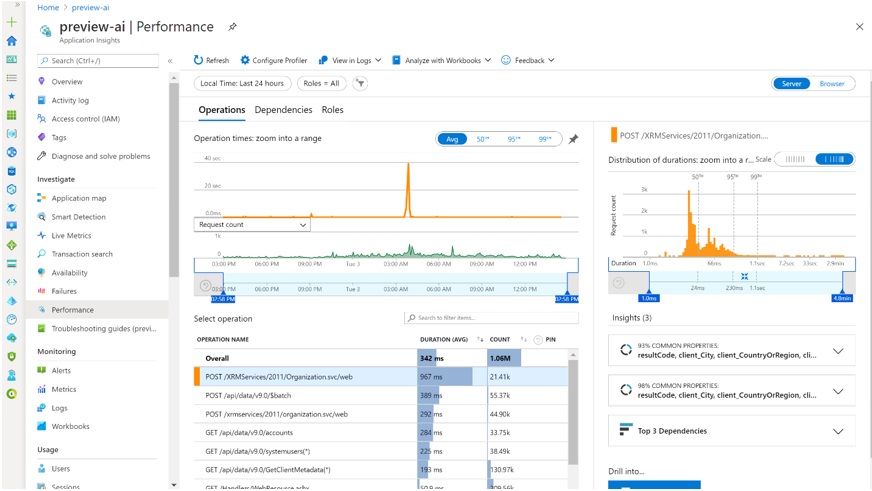
The Application Insights Azure resource tracks both client and server side actions. For example, if you go on to the Performance section of the Investigate pane, you can see both server et browser related operations.
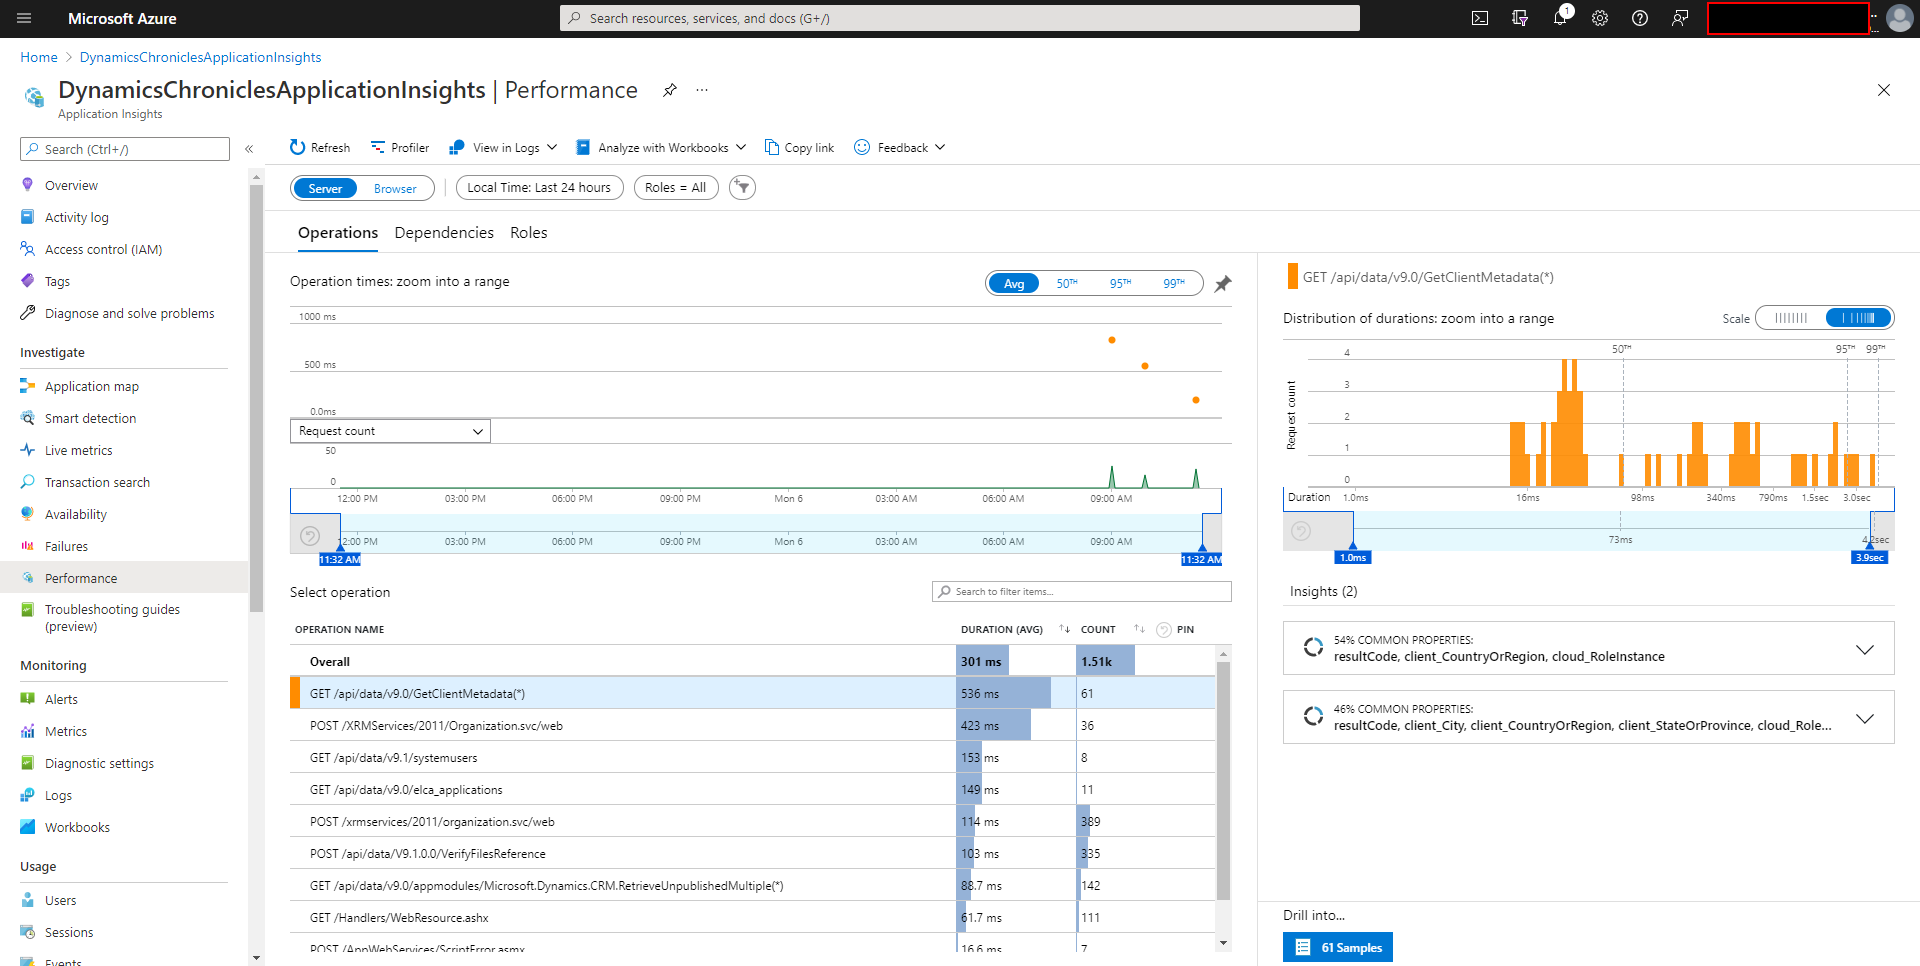
There are a lot of information possible, from the performance to the number of request.
Among all other tools offered by Azure Monitor, there is also the Failures section.
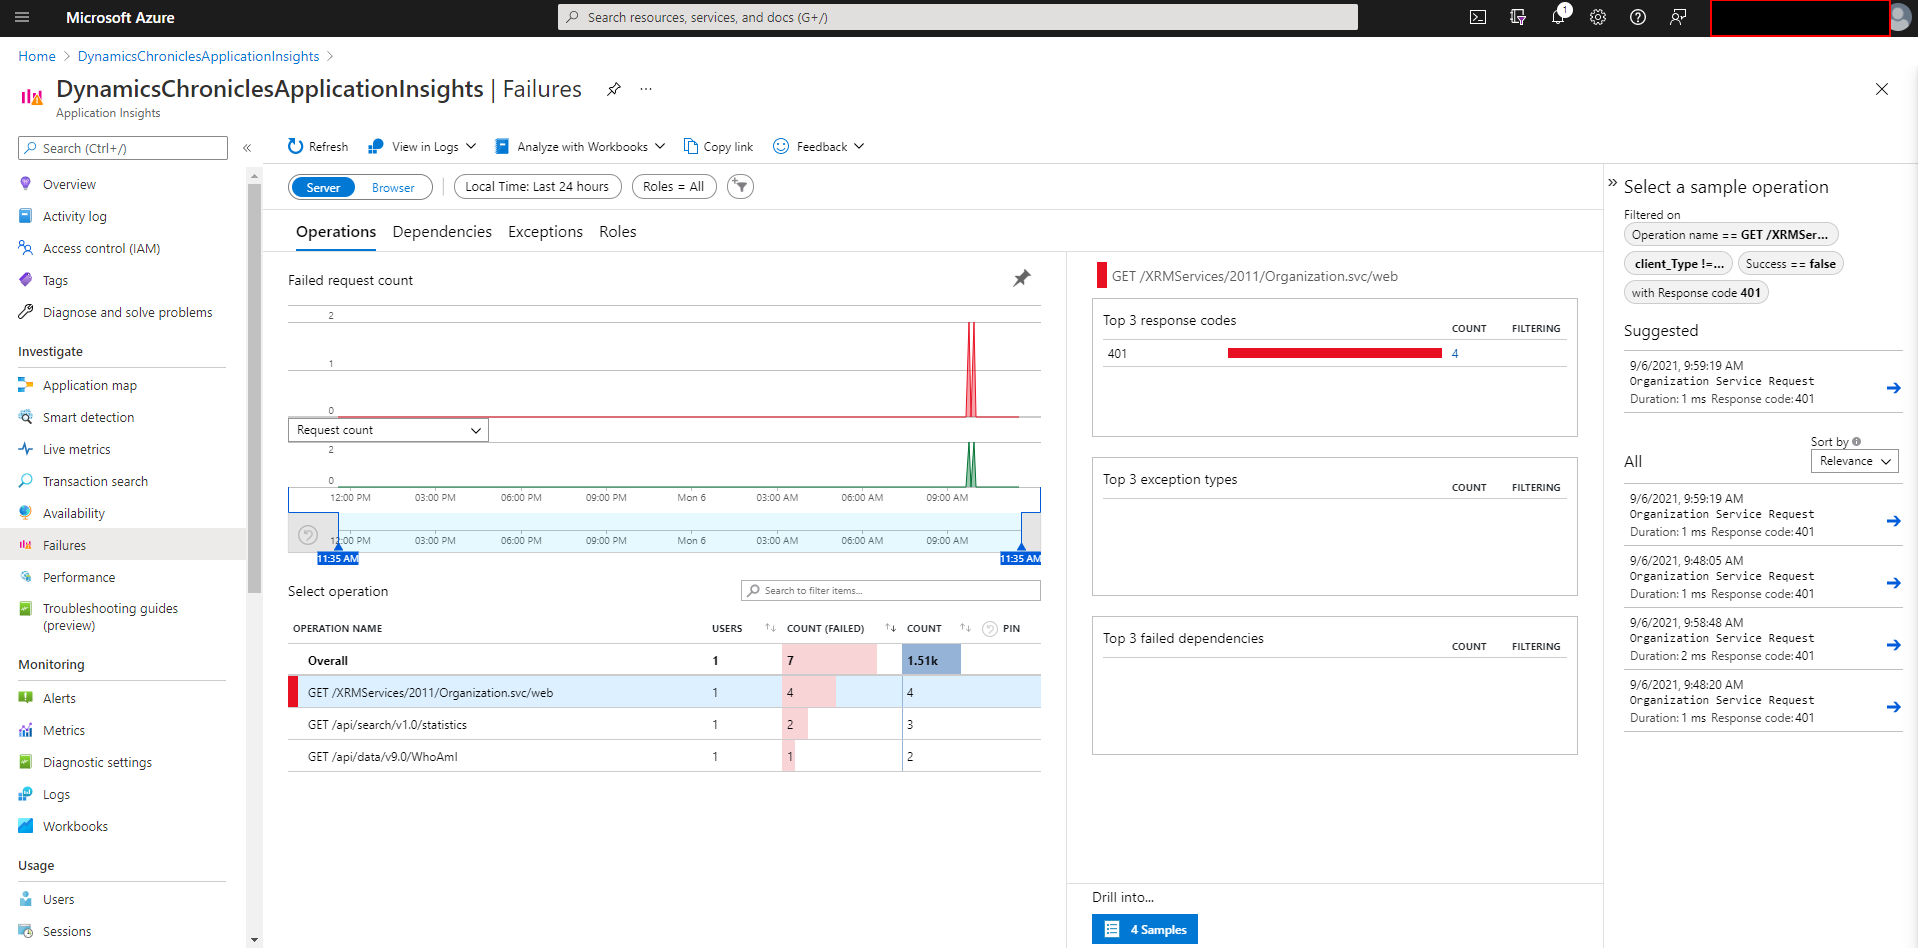
Reference
- Microsoft's Tracing and logging documentation
- Microsoft's Dataverse Release 2021 Wave 1
- Microsoft's Dataverse Plug-in
- Application Insights and Telemetry
Dataverse Plugin telemetry with Azure Application Insights

Comments
Logging not working using PluginTelemetry
Dear Danny.
Thanks for the great article.
For some reason I followed all the steps but its not logging any info or error.
Does D365 need to be set to use Application Insights, apart from pointing the Dataverse Data Export setting.
Thanks,
George
Ilogger not working on code activity
I am trying to do same with the custom code activity but its not working