Description
Until now, we always have had little transparency into the flow of actions and requests made while loading a Dynamics 365 page. One of the most used tools was to search in the complexity of the browser developer's tools or using Fiddler to analyze web requests. It was hard to find events and logs that could help diagnose performance and functional issues.
Microsoft has released the Monitor tool to empower users to understand what's happening under the hood of their applications. Supporting canvas and model-driven apps, the Monitor tool provides a way to view a stream of events from a user’s session to diagnose an issue:
- KPI for page loads, command executions, and other major events
- Network request details
- Warnings for synchronous XHR’s
- Custom script errors (e.g. onload, ribbon rule evaluation)
- Form execution event details (e.g. onload, onchange)
- Form visibility reasons for controls and related menu items
- Power BI control failure and performance events
How/why is this helpful?
Well, thanks to the "Join" functionality, you can spare your users from having to send you the log files to start with, and, besides, you may be able to see not just the error itself in the monitor session, but, also, a lot of contextual client-side information about the error itself, and, also, about the client-side events which happened before or after the error and which might have lead to the error.
How to connect
There are two ways to enter a Monitor session for model apps.
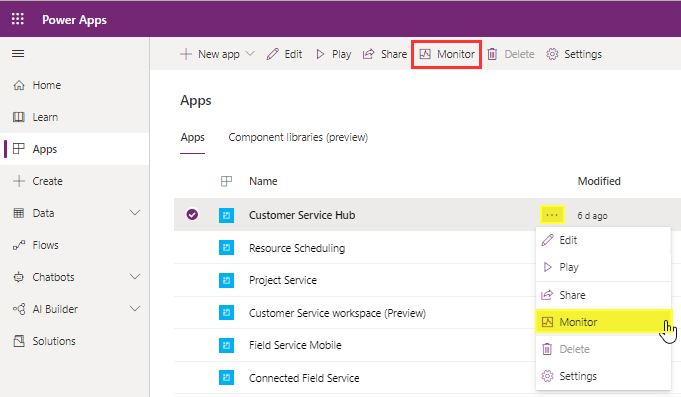
- From the apps page (make.powerapps.com), select any model-driven app, and use the command from the top bar or the context menu to launch Monitor (red rectangle below).
- From the apps page (make.powerapps.com), select any model-driven app and click on the three dots on the right of the app name. Select “Monitor”
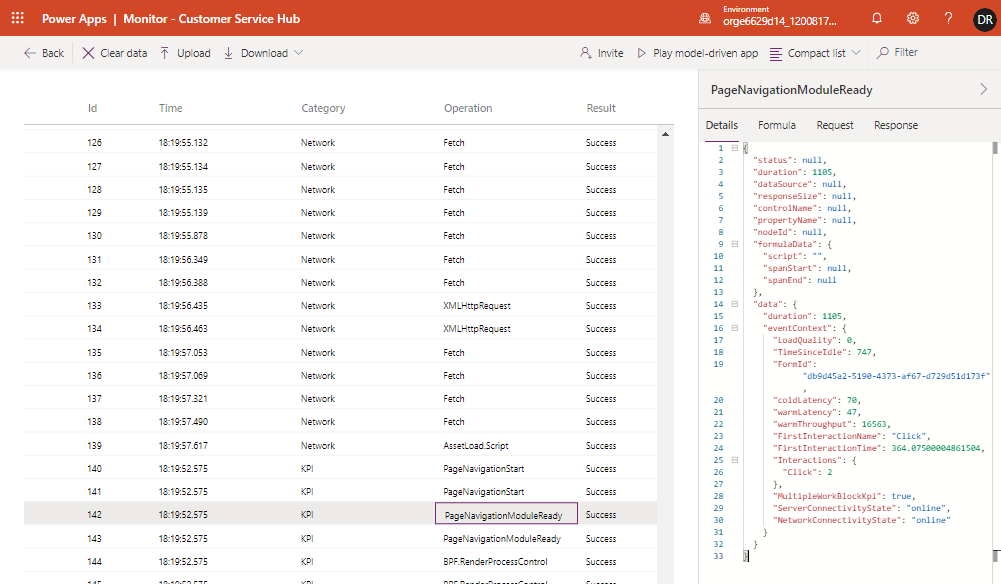
This opens a new tab where the monitor logs will be displayed. On the top right, there are two important buttons:
- Play model-driven app: Click to open the app. All actions will then be monitored and logged.
- Invite: Invite people to join the monitor session. Anyone joining the session will see all the events generated by the app, including any data. Once they have joined, closing this browser tab will end the session for all participants.
References