Dynamics 365 : Custom chart with HTML and JS
In this article, I will explain how to customize chart map in a classic mode such as CRM2011, CRM Onpremises v8.2, ... then how to adapt it for D365 Online and Unified Client Interface which I have face in real project. Of course we could use Power BI, but this article will give you another option by using custom code without dependencies with other BI services.
1. How to customize a chart:
In this section, we will go throw steps to create own custom chart. This process is quite simple and does not require much coding base.
- Create basic HTML page: here are an example of very basic HTML page will be display in the chart
<html>
  <head>
    <title>Example Page</title>
  </head>
<body>
  <div style="height:50%" ></div>
  <div style="text-align:center">
  <b>Example web resource for the Accounts grid</b>
</div>
</body>
</html>
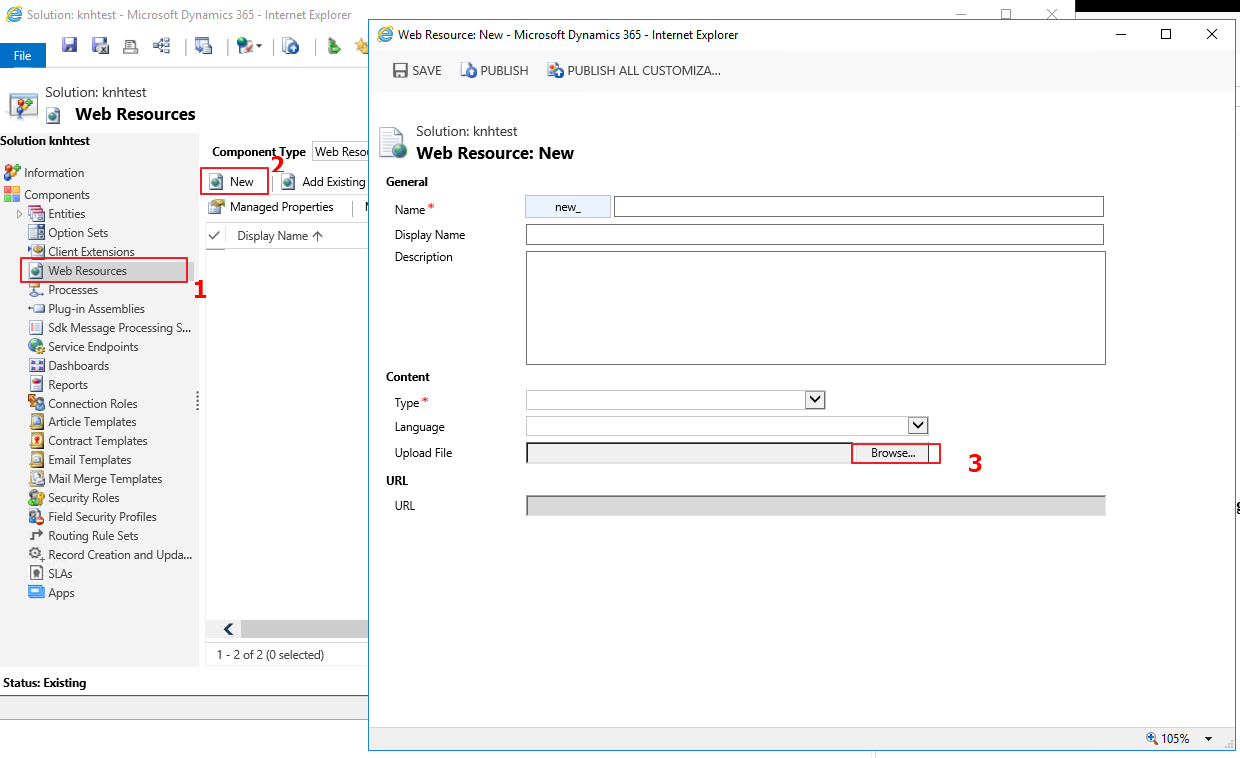
- Add HTML page to CRM : there are various way to add this HTML page to server but I think the simplest way is: go to solution and create a webresource then browse to the HTML you already created:
- Create a chart xml: use the following format
<visualization>
  <primaryentitytypecode>account</primaryentitytypecode>
  <name>Example Chart</name>
  <webresourcename>dd_chartMap.htm</webresourcename>
</visualization>
Attribute definition:
- primaryentitytypecode: the entity which the chart will be display on
- name: name of the chart
- webresourcename: the name of webresource that will be load when the chart is rendered. This value should set to the created webresource above.
Then go to solution -> Account -> Chart -> More Actions -> Import Chart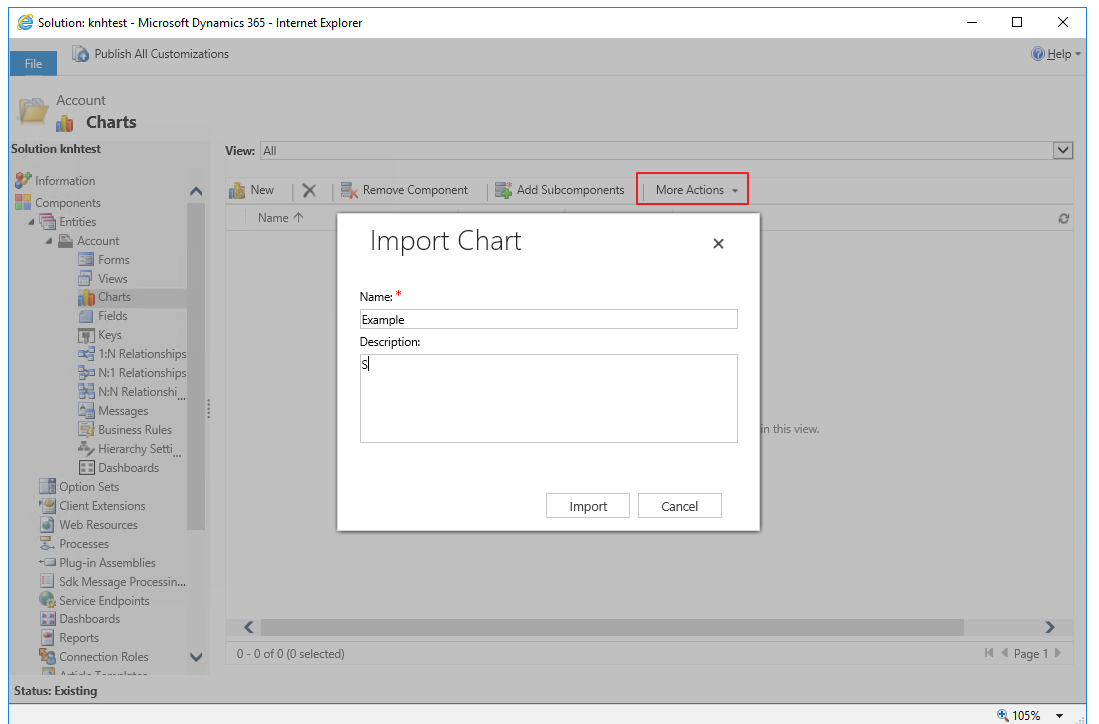
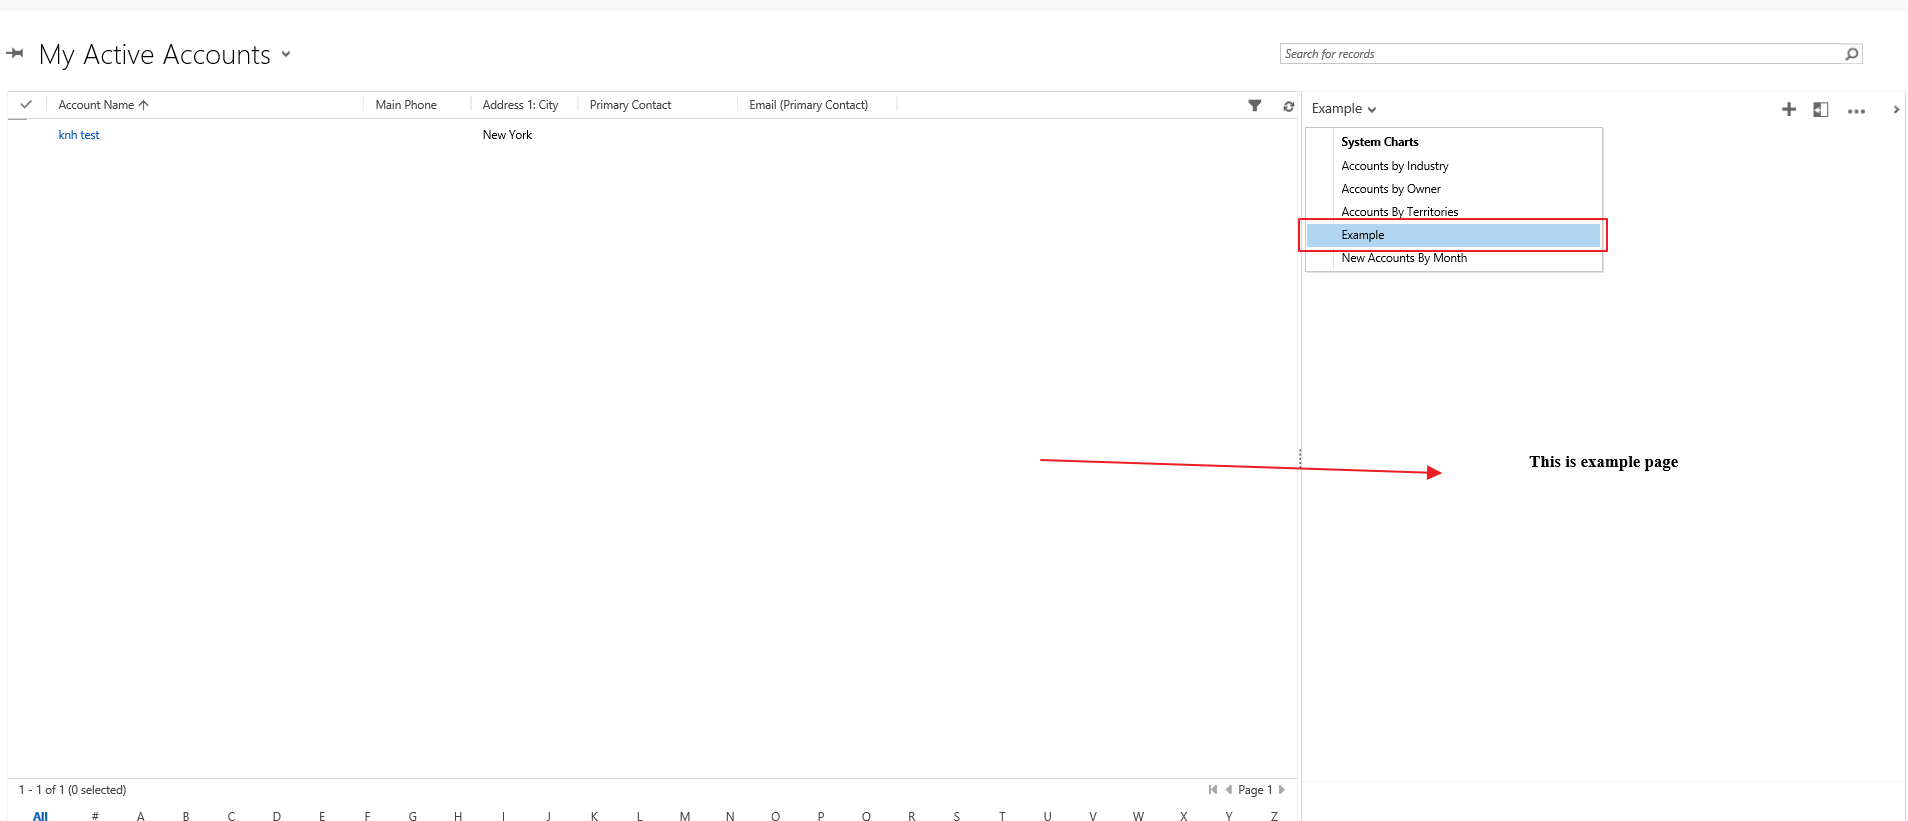
Here is the result after we import chart successfully. Since this chart is build from a webresource (HTML page) so we could use any javascript in this HTML page to build custom chart as you want.
2. How to create Chart map:
How does a web resource know which chart is being rendered?
If you have worked with web resources placed on forms/dashboards, you would be aware of the data query-string parameter. This parameter essentially lets the same web resource render differently in different contexts – you specify the value of this parameter (if required) at the time of adding the web resource to a particular form/dashboard.
For web resources rendering as charts, we do not let you explicitly specify a value for this parameter. Instead this parameter is always set to (a URL-encoded form of) the following format:
visid=<Visualization ID>&vistype=<Visualization Type>&viewid=<View ID>&viewtype=<View Type>
Therefore, we can get the ID and type of the chart being rendered by parsing the data query-string parameter.
Web resource for chart map: here is an example which you could find it easy on internet
<html>
<head>
    <title>Accounts on Bing Maps</title>
    <script type="text/javascript" src="http://ecn.dev.virtualearth.net/mapcontrol/mapcontrol.ashx?v=6.3"></script>
    <script type="text/javascript" src="http://ajax.googleapis.com/ajax/libs/jquery/1.4.2/jquery.min.js"></script>
    <script type="text/javascript" src="ClientGlobalContext.js.aspx"></script>

    <script type="text/javascript">
        var map;

        // Function to construct key-value pairs from a query string.
        function getParametersFromQuery(query) {
            var parametersDictionary = new Array();
            var parameters = query.split('&');
            for (var i = 0; i < parameters.length; i++) {
                var keyAndValue = parameters[i].split('=');
                parametersDictionary[unescape(keyAndValue[0])] = unescape(keyAndValue[1]);
            }
            return parametersDictionary;
        }

        // Function that makes a GET request to the CRM REST end-point, and invokes a callback with the results.
        function retrieveFromCrmRestApi(url, callback) {
            $.ajax({
                type: "GET",
                url: GetGlobalContext().getServerUrl() + "/XRMServices/2011/OrganizationData.svc" + url,
                contentType: "application/json; charset=utf-8",
                dataType: "json",
                success: function (data) {
                    callback(data.d);
                }
            });
        }

        // Function that retrieves the corresponding CRM chart, and invokes the callback when successful.
        function loadChartFromCrm(callback) {
            var parameters = getParametersFromQuery(window.location.search.substring(1));
            parameters = getParametersFromQuery(parameters["data"]);

            var id = parameters["visid"].substr(1, 36);
            var type = parameters["vistype"];
            var url = (type == "1111" ? "/SavedQueryVisualizationSet" : "/UserQueryVisualizationSet")
                + "(guid'" + id + "')?$select=DataDescription,PresentationDescription";
            retrieveFromCrmRestApi(url, callback);
        }

        var locations = new Array();
        function plotAccountLocations(accounts) {
            if (accounts.length > 0) {
                var account = accounts.pop();
                var address = account.Address1_City + ', ' + account.Address1_Country;
                map.Find(null, address, null, null, 0, 1, false, false, false, false,
                    function (shapeLayer, results, places, moreResults, error) {
                        if (null != places && places.length > 0) {
                            var place = places[0];
                            var newShape = new VEShape(VEShapeType.Pushpin, place.LatLong);
                            newShape.SetTitle(account.Name);
                            newShape.SetDescription(address);
                            locations.push(newShape);
                        }
                        // When we have found (or not found) the current account,
                        // recursively call the same function to find the next one.
                        plotAccountLocations(accounts);
                    });
            }
            else {
                var shapeLayer = new VEShapeLayer();
                map.AddShapeLayer(shapeLayer);
                shapeLayer.AddShape(locations);
            }
        }

        function loadAccountsFromCrm(dataDescription) {
            var url = "/AccountSet?$select=Address1_Country,Address1_City,Name";
            if (null != dataDescription) {
                // Filter accounts based on country specified in data description.
                url += "&$filter=Address1_Country eq '" + dataDescription + "'";
            }
            retrieveFromCrmRestApi(url,
                function (data) {
                    var results = data["results"];
                    var accounts = new Array();
                    for (resultKey in results) {
                        accounts.push(results[resultKey]);
                    }
                    // Once accounts are retrieved from CRM Server, plot their locations on map.
                    plotAccountLocations(accounts);
                }
            );
        }

        function getMap(presentationDescription) {
            // Set center and zoom defaults.
            var center = null;
            var zoom = 4;
            if (null != presentationDescription) {
                // Calculate map-center and zoom from the presentation description.
                var arguments = presentationDescription.split(',');
                if (arguments.length > 1) {
                    center = new VELatLong(arguments[0], arguments[1]);
                }
                if (arguments.length > 2) {
                    zoom = arguments[2];
                }
            }
            map = new VEMap("map");
            map.LoadMap(center, zoom, VEMapStyle.Road, true, VEMapMode.Mode2D, false, 0);
            window.onresize = function (event) { map.Resize(document.body.clientWidth, document.body.clientHeight); };
            window.onresize(null);
        }

        function loadMap() {
            // First, get the chart object from CRM Server.
            loadChartFromCrm(
                function (chart) {
                    // Once we have retrieved the chart, format the map based on the chart's presentation description.
                    getMap(chart.PresentationDescription);
                    // Get Accounts from CRM Server based on the chart's data description, and plot them on the map.
                    loadAccountsFromCrm(chart.DataDescription);
                }
            );
        }
    </script>
</head>
<body onload="loadMap()">
    <div id="map"></div>
</body>
</html>
-
In this snippet code, there are
- loadMap: handle logic for event onload of webresource
- loadChartFromCrm: Retrieve DataDescription and PresentationDescription of the current chart from the CRM 2011 oData end-point. Note the double-call to a function that parses a query-string.
var parameters = getParametersFromQuery(window.location.search.substring(1));
parameters = getParametersFromQuery(parameters["data"]);
Because when the chart is rendered, all information of chart will be encode in URL so this function will parse the URL and get parameter inside.
- getMap: Use Bing Map APIs to load a map with the center and zoom-factor specified in presentation-description.
- loadAccountsFromCrm: Retrieve account records from CRM 2011 oData end-point, filtered by the country specified in data-description.
- plotAccountLocations: Add push-pins on the map to represent each of the account records retrieved above.
Create a new chart that use this web resource

3. How to adapt chart map for D365 Online and Unified Client Interface (UCI):
I have faced with this issue when we want to upgrade version of CRM to later version like v9.0 and change to use UCI and it breaks the feature because in the UCI, when the chart is render, the parameters of the chart has change when it's renderd.
I did my test on a v9.0 on premise but it always works for Online version!
This is an example of url where the chart is render in UCI:
http://testingOrg:5555/Test/main.aspx?appid=1237ef-eab5-ea11-9123-005056bc865b&pagetype=entitylist&etn=account
As you could see, All of informations which we could get from URL are: the pagetype and entity name.
So basically we will not have enough parameter as the chart want in the UCI mode. They are not supported in the UCI mode. However, if you really want this feature in UCI, we could achieve this goal by using an unsupported way.
Let's have look at which paramters will be encode in classic mode:
visid=<Visualization ID>&vistype=<Visualization Type>&viewid=<View ID>&viewtype=<View Type>
and the piece of source that consume paramters:
        function loadChartFromCrm(callback) {
            var parameters = getParametersFromQuery(window.location.search.substring(1));
            parameters = getParametersFromQuery(parameters["data"]);

            var id = parameters["visid"].substr(1, 36);
            var type = parameters["vistype"];
            var url = (type == "1111" ? "/SavedQueryVisualizationSet" : "/UserQueryVisualizationSet")
                + "(guid'" + id + "')?$select=DataDescription,PresentationDescription";
            retrieveFromCrmRestApi(url, callback);
        }
So the source code needs 2 parameters from URL: visid and vistype (name of entity).
We could easily get vistype from URL in UCI which contains: &etn=account. So the problem remaining is how to visid?
Let's have a look at DOM:
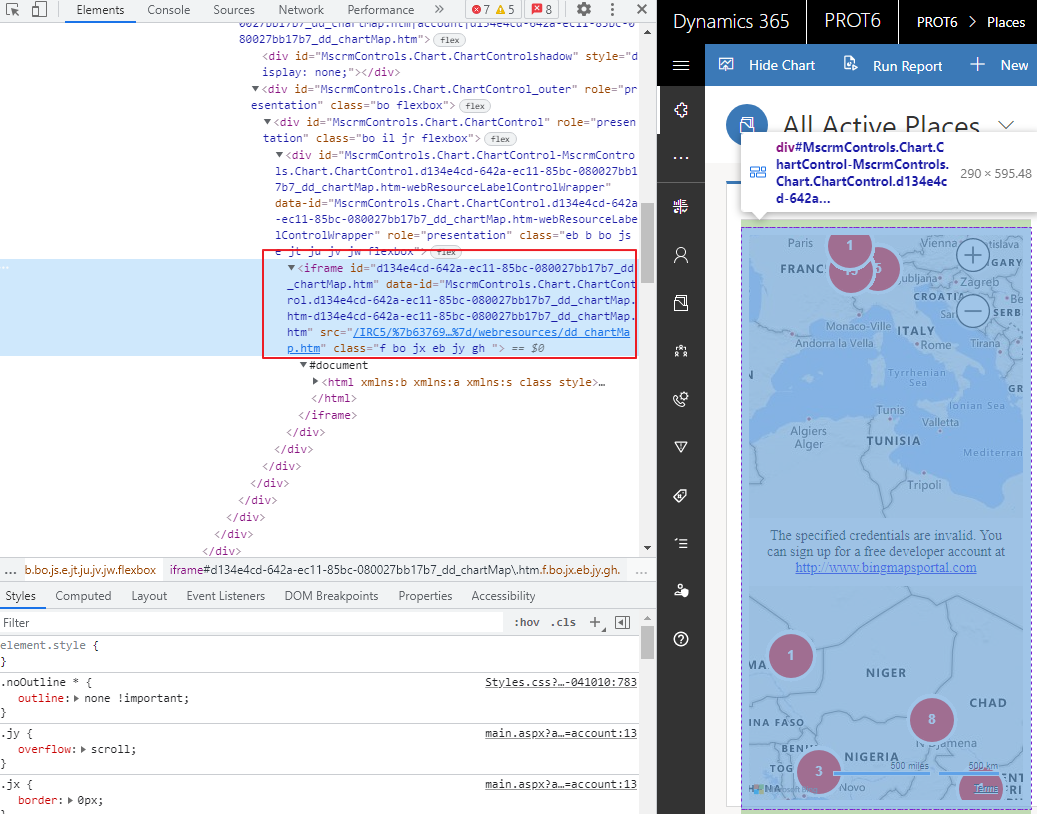
And I found that the first iframe id will contain the visid of chart. Finally, I could get the id of chart (visid) by following code:
                    var iframId = parent.document.getElementsByTagName("IFRAME")[0].id;
                    visid= "{" + iframId.replace('_dd_chartMap.htm', '') + "}";
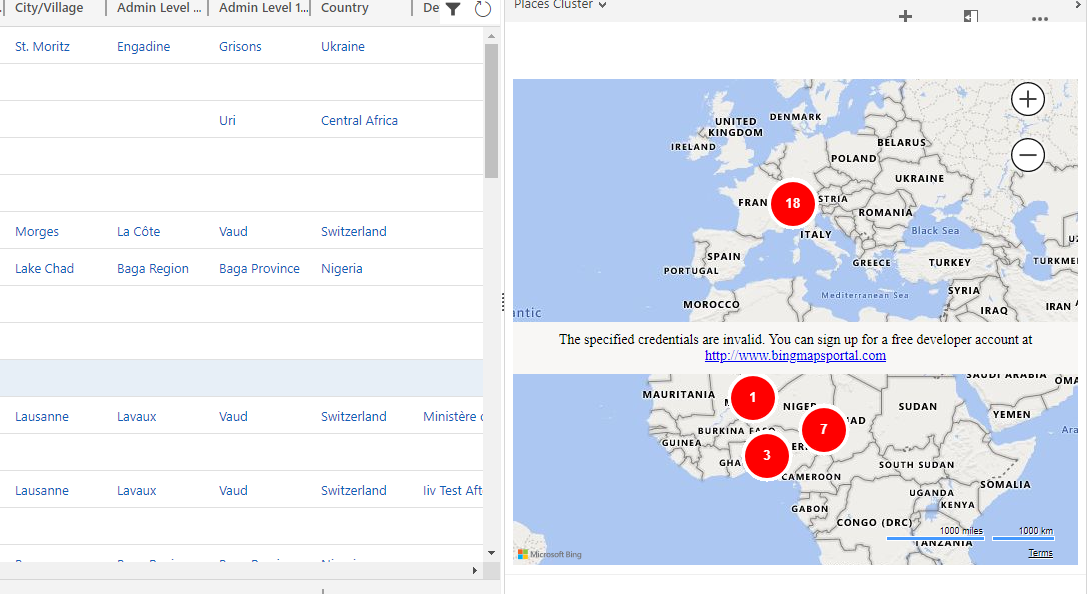
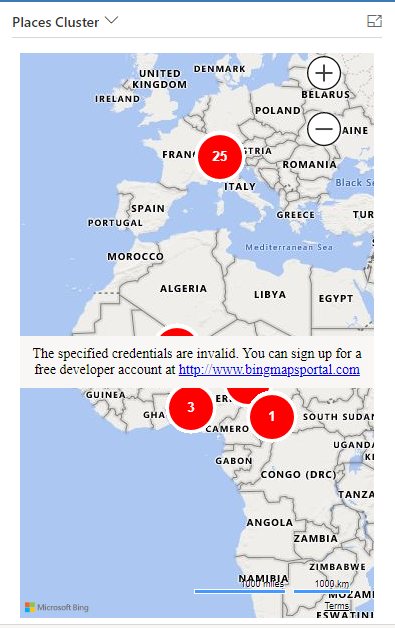
The result in UCI:
Summarize:
This is unsupported way to overcome the issue related chart map in UCI due to the change of URL. I don't recommend to do this unless you have no option to go.
If you have any solutions, please feel free to share and I'm very pleasure. This topic has come when I work in real project.
Dynamics 365 : Custom chart with HTML and JS