

How to remote debug Azure Function
As you know, Azure Function are very useful for Dynamics 365 and Dataverse integrations. Any self-respecting developer has the need to step-by-step debug his code. But how to do it when working with an Azure Function? Indeed, this one can be debugged locally thanks to the Azure Function emulator offered by the Azure Visual Studio SDK, but how to debug the function in real time directly from its Azure hosting?
Prerequisites
First of all, here are the prerequisite steps to activate the remote debugging :
- Go to the Azure Portal.
- Navigate to your Function App.
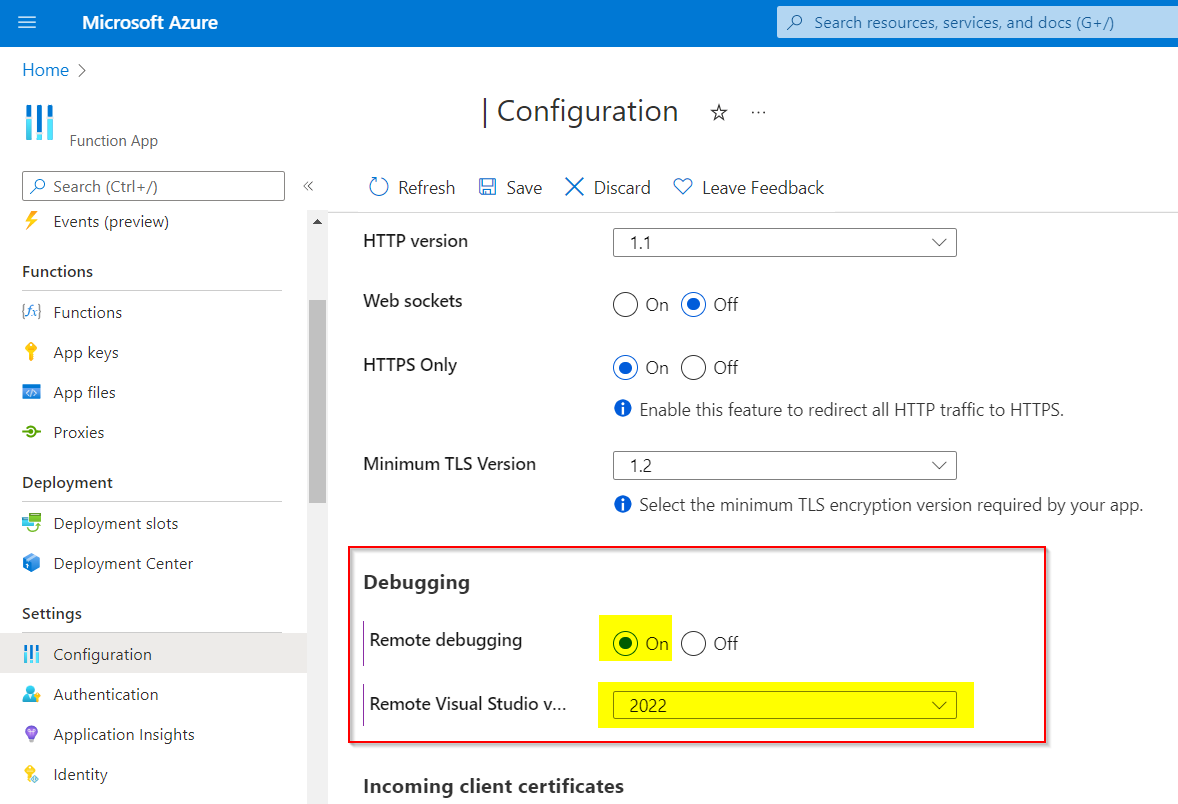
- Click on Configuration in the left menu.
- Then on the General Settings tab at the top of the page that appears.
- Next you will see a Debugging section.
- Enable Remote Debugging
- Finally, choose the version of Visual Studio that you will use.
On the Azure Function App side, the Msvsmon service runs in the backend, moreover you can very well see and manage it from the Kudu interface. This service works by using a specific port to establish communication with the client, here your Visual Studio.
In this case, you must ensure that your local or corporate firewall allows communication on this port.
Here is the list of ports to open depending on the versions of Visual Studio :
- Visual Studio 2022: 4026
- Visual Studio 2019: 4024
- Visual Studio 2017: 4022
- Visual Studio 2015: 4020
- Visual Studio 2013: 4018
- Visual Studio 2012: 4016
- Source
Actions in Visual Studio
Then, depending on your version of Visual Studio the steps may differ. Overall it's the same principle, it's about establishing a communication with the remote debugger and attaching to the remote W3WP process.
Universal option working with all Visual Studio.
Here is a generic option that will allow you to perform your debugging and even to understand what is happening behind the scene of the other more automated options below.
- Open your Visual Studio solution containing the Function App to debug.
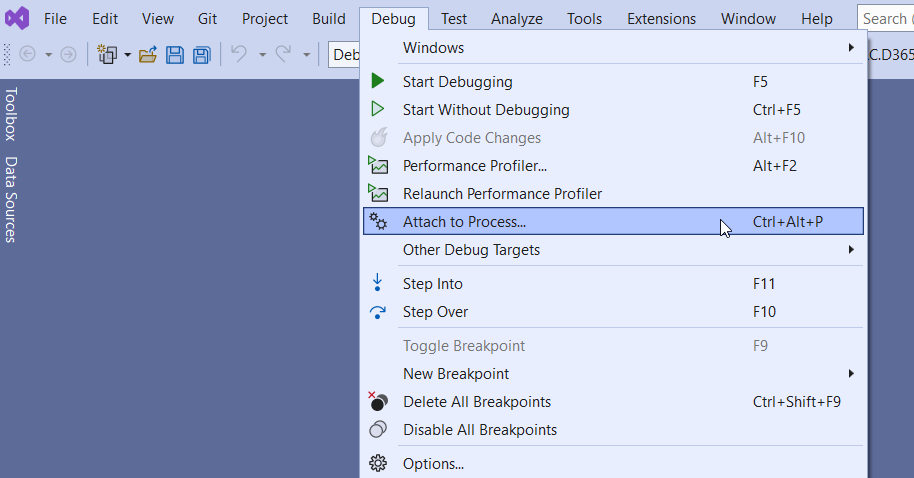
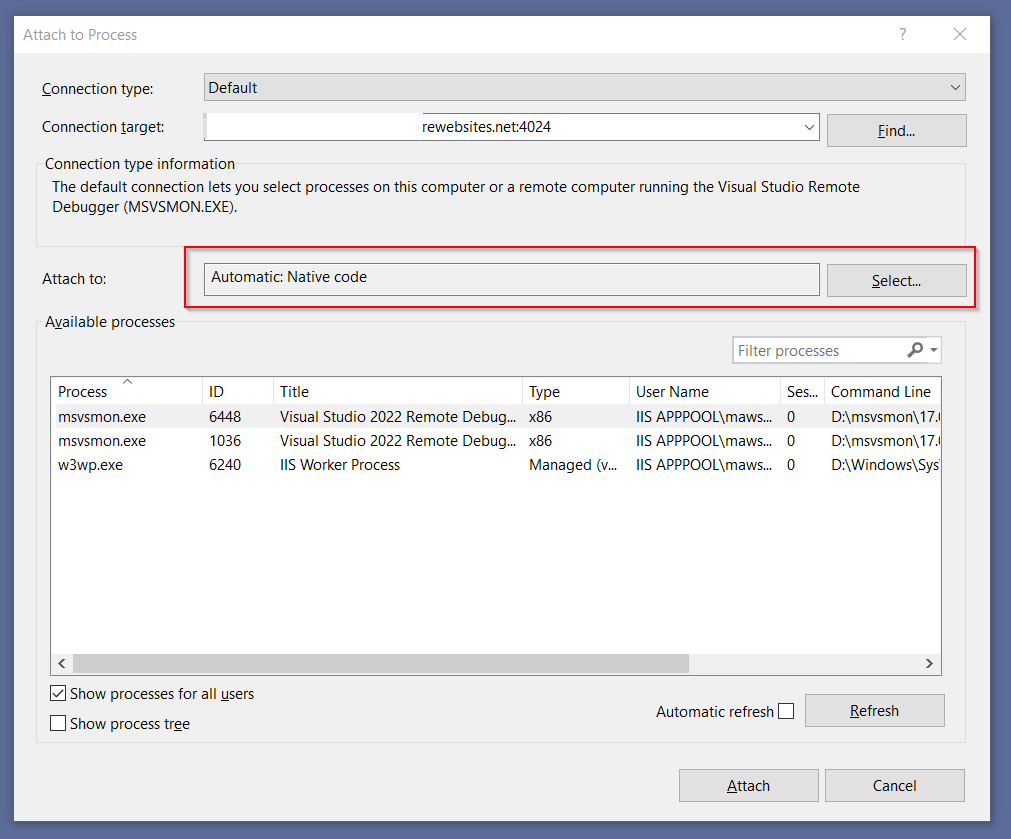
- Click on Debug -> Attach to process
- In Connection Target enter the full DNS of your Function App + ":" and the port according to your VS version. Example: myfunctionapp.azurewebsites.net:4022. Do not click on the Find button but simply press ENTER.
- A Windows authentication prompt should appear. If you have an error at this step please refer to my tip below.
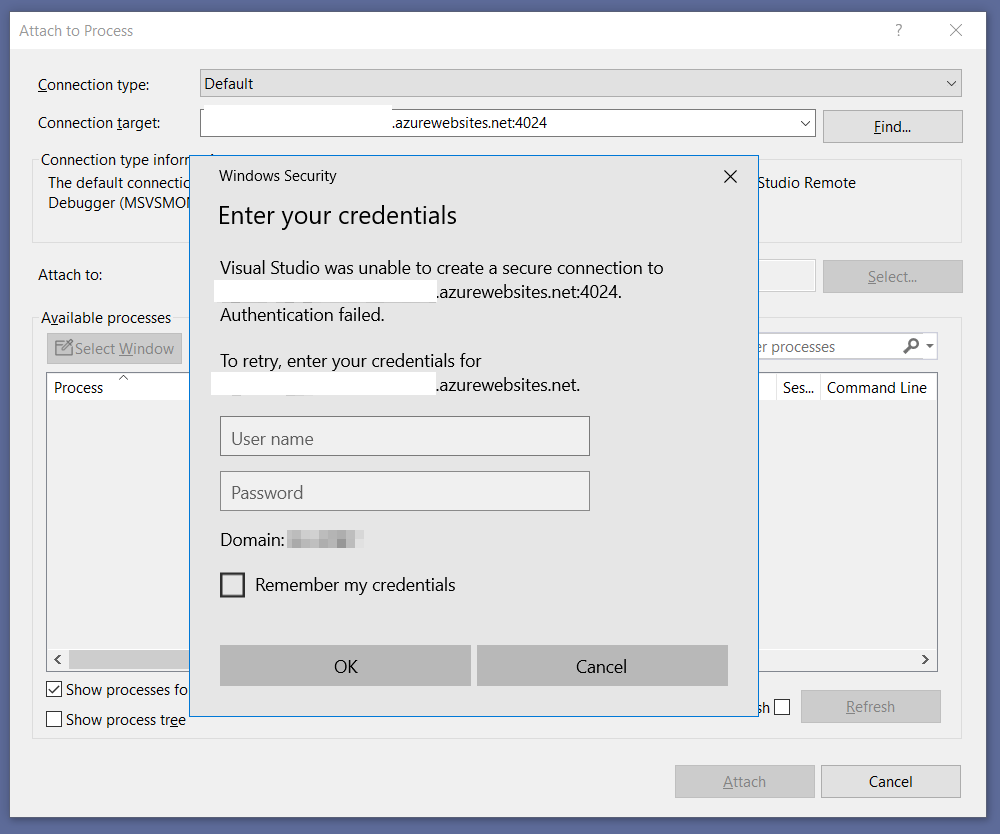
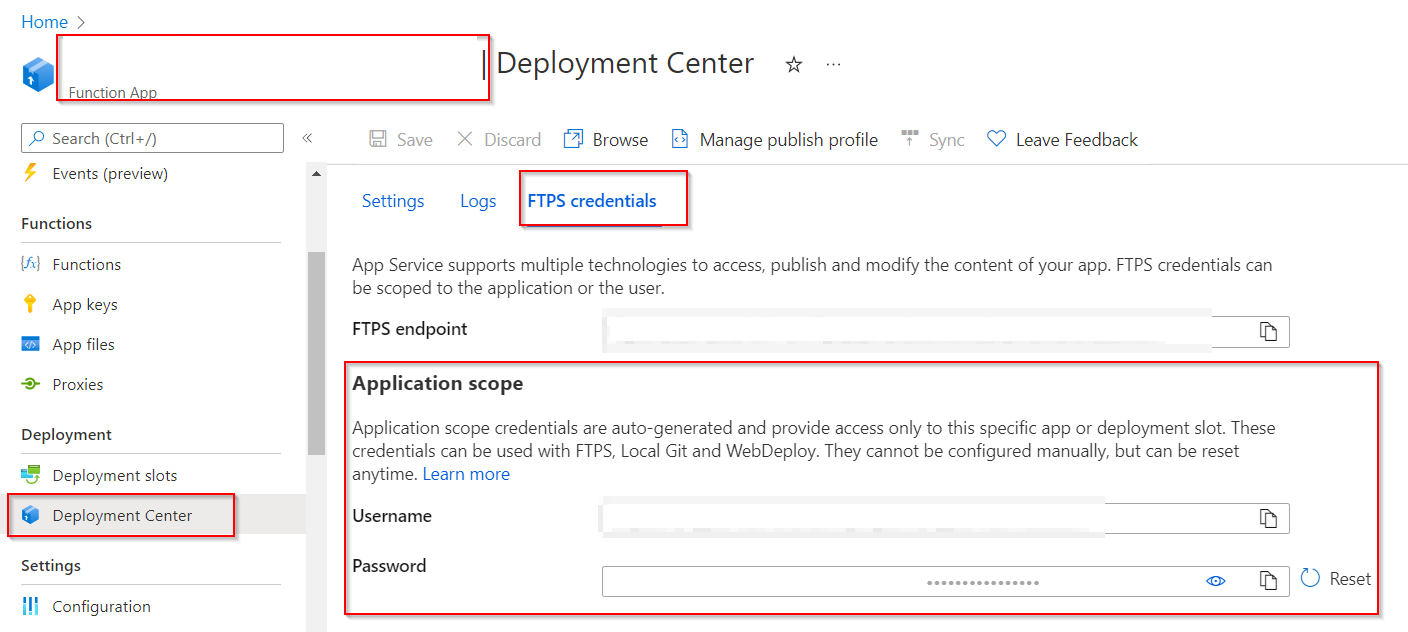
- Then enter the login and password of the account: Application Scope. You can find it by going to Azure Portal, on your function in the Deployment Center section, FTPS credentials tab, Application Scope section. As shown below.
- Once authenticated you should see the processes available on the Azure Function host. Be careful, if you are using .NET Core code you will have to change the type code and choose Managed CLR.
- You can then select the W3Wp.exe process, then click on Attach.
- Very important point: If your symbols do not load, it is because you must deploy and debug a Release version and not a Debug version of your code!! Otherwise, you should disable the Just My Code option in the Visual Studio options...
Authentication error :
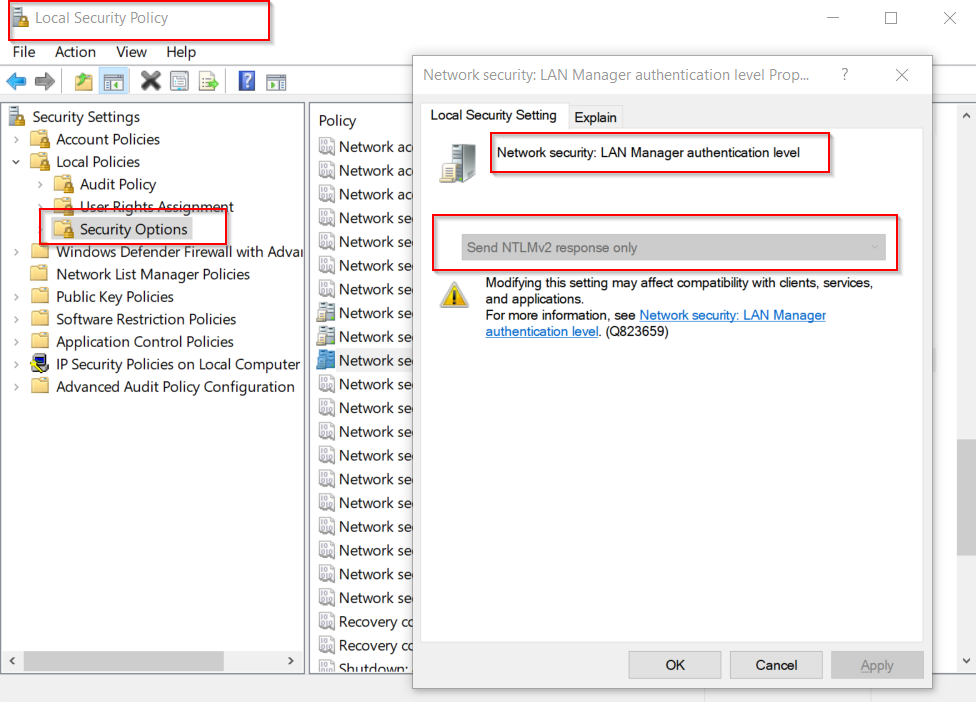
Although the auth error can be various, here is a solution that saved me. You need to modify a Windows Policy which allows you to define which authentication protocol is used by default during Windows prompts of this type.
- Go to Local Security Policy of your Windows
- Locate the Policy Security named: Network Security: LAN Manager Auth Level.
- Set the value to Send NTLMV2 response only
- This will allow you to authenticate yourself to the service!
Option using Azure Cloud Explorer.
If you have the Azure extensions for VS installed you will be able, depending on your version, to have access to the Cloud Explorer which will allow you to navigate directly to your Azure Functions from VS.
Then the steps are almost the same as above, Microsoft has simply simplified the Attach Debugger.
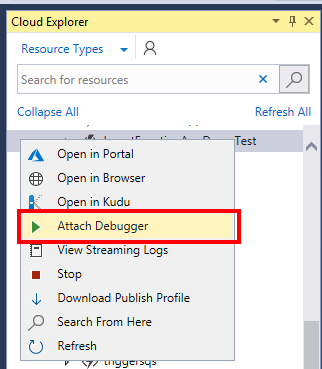
You can then follow exactly the same steps as described above.
Newest option: Visual Studio 2022 via Profiles
In fact, the Cloud Explorer is no longer usable, you must use the notion of Publish Profile which you can also use to deploy your Functions. Then, in this function there is the possibility to directly attach the remote debugger. Since the Profile already has the credentials, you won't even need to enter them again. Everything is done automatically! Thank you Microsoft!
Here are the steps:
- From your Visual Studio solution, right click on the desired Function App project. Then click on Publish
- Fill in your Publish Profile (not covered in this article) or use an existing one.
- Publish your Function in Release mode by selecting this option in the Settings section
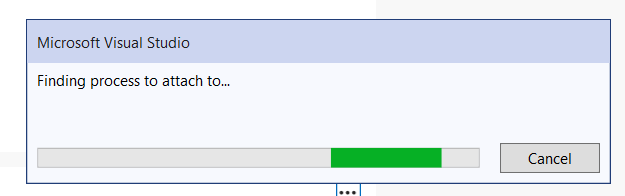
- Once published, click on the three small dots and in the Menu select Attach Debugger.
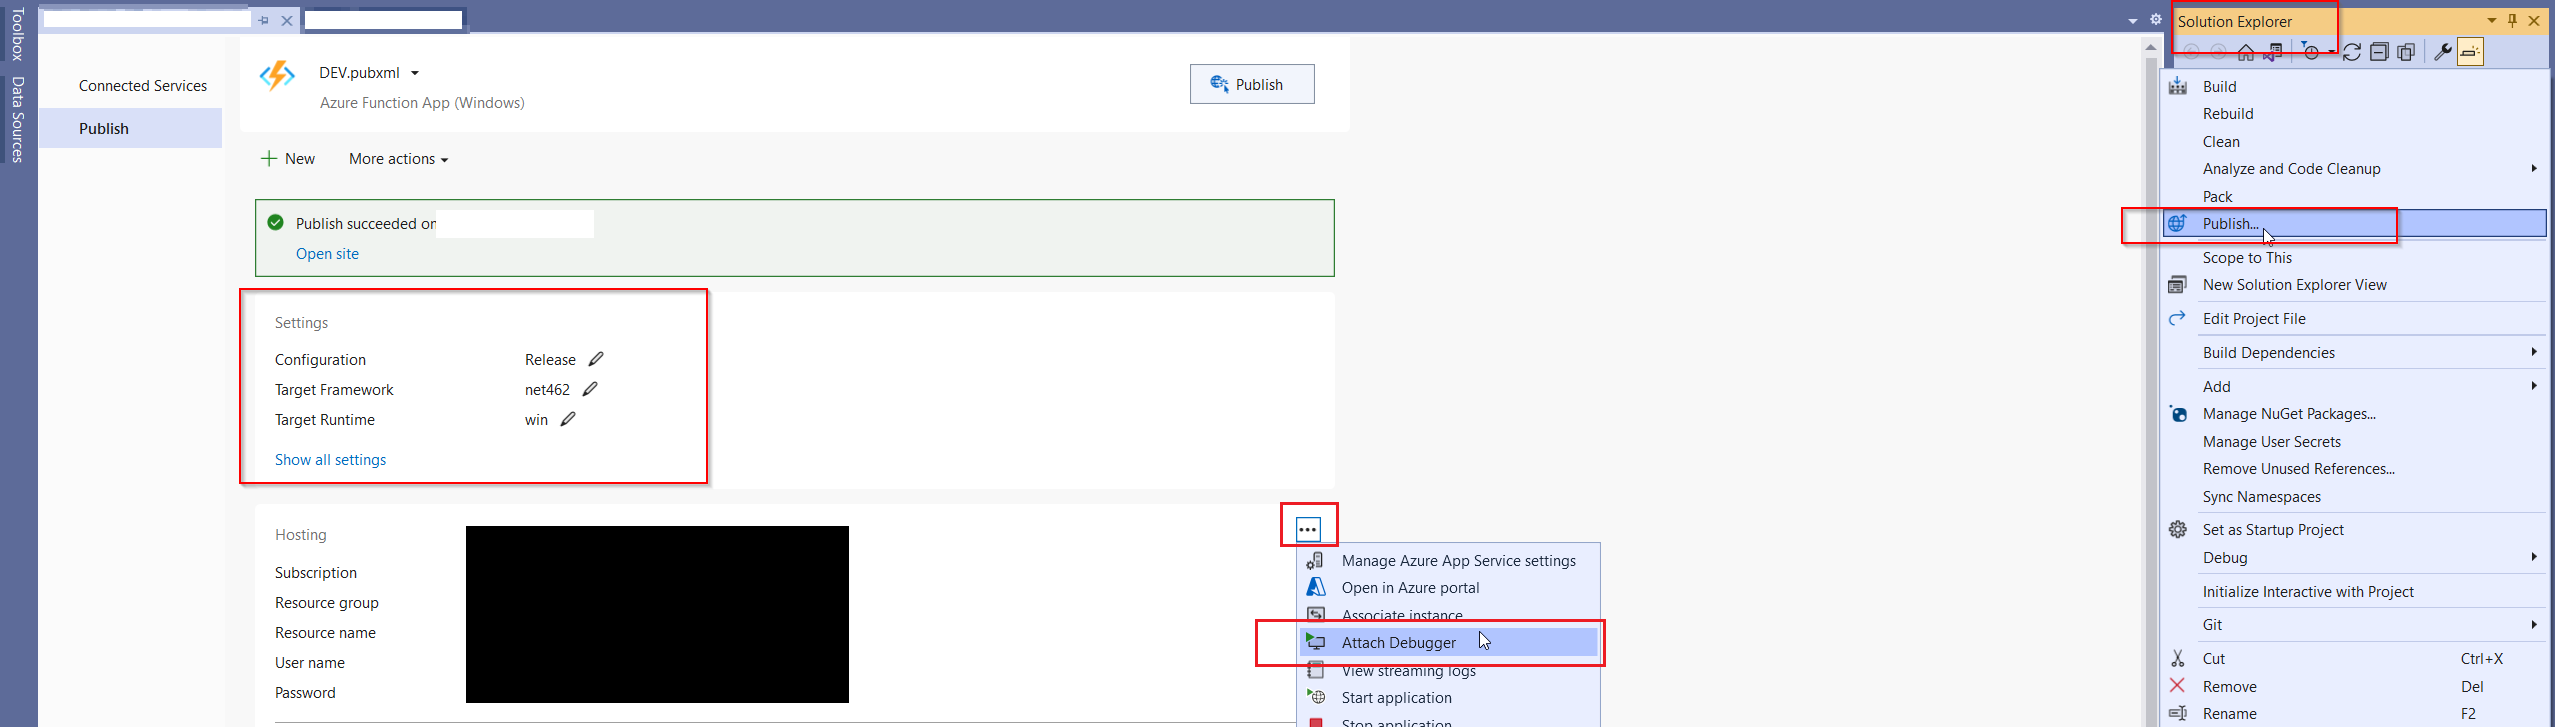
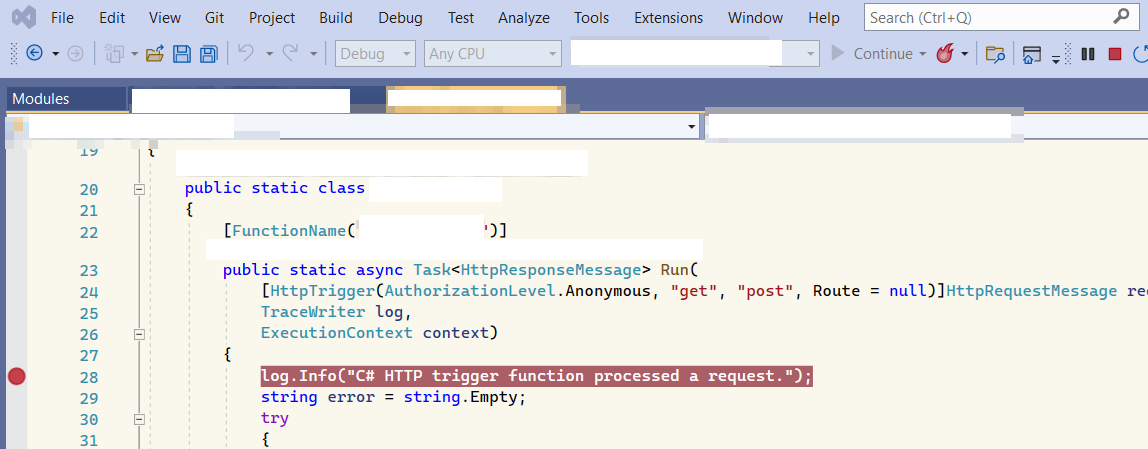
This will perform the operations automatically, your Break Points and symbols should be loaded correctly.
You can then use whatever way you prefer to execute your remote Function. Personally I just use PostMan. Once the function is called from PostMan, the breakpoint will be reached and you will be able to debug your code step by step and finally understand what is wrong!!! ;)
Conclusion
We have demonstrated here how to use the remote debugger for Azure Function via different options offered by Microsoft. There are indeed a lot of generic errors encountered contextually by different users, I hope the process will be simple for you by following this article.
How to remote debug Azure Function

Comments
in the steps "In Connection…
in the steps "In Connection Target enter the full DNS" hit an error "Unable to connect to "function" the VS 2022 Remote debugger does not appear to be running on the remote computer. this may because a firewall is preventing communication to the remote computer."
How should I disable the firewall?
Hi, you should first check…
Hi, you should first check with your local Windows Firewall, then if it is allready good and still not working, it means that there is probably a corporate firewall that does not allow this. Then two choices. 1. You switch your network connection to something less restrictive (such as mobile hotspot) 2. Ask your corporate IT to deal with. Good luck
How to determine firewall block
How would you determine a firewall block? Is ping or tracert or some other tool needed?