The Advanced Chart Editor tool allows users to customize every property of a chart within a user-friendly manner
Description
The Advanced Chart Editor enables users to update charts in Dynamics 365 without having to export them first. The tool offers multiple ways to edit the properties of a chart, either directly in the XML – more or less as always - or via an interface – that’s new.
The Advanced Chart Editor plugin goes far beyond simply changing the columns of the chart. It enables us to edit all properties of the series and the axis. For example, you can edit the color of the chart or even the label of the axis.
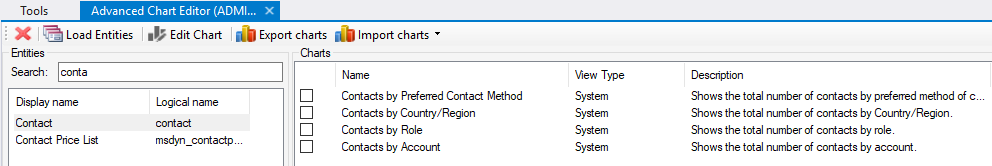
The interface of the tool allows to:
- “Load Entities” and select an entity. Search from the search bar useful.
- From the selected entity, select the chart to modify.
- Actions
- Export chart
- Export all selected charts and create an XML file per chart. By ticking multiple boxes, multiple selections are possible.
- Import charts
- Either a specific XML file or all XML files from a folder.
- Be careful here! Once selected, the charts will be directly uploaded and published to the Dynamics 365 instance!
- Edit Chart
- Edit the chart currently selected – not ticked, selected!
- A new pop-up window will appear with the name, type, and description of the chart. Below there are two XML sections: the “Data Description” and the “Presentation Description”. The XML text can be edited directly from there.
- There are also a few buttons on the bottom of the pop-up. Those buttons are:
- Open Visual Editor: Edit all configurations and parameters linked to the carts. Users now don’t want to modify the chart via the XML files can also use the Visual Editor to modify the chart. There is a mouse hover text on each property to give some indications to users.
- Preview, Update & Publish, Delete Chart, Saves As, and Close buttons speak for themselves.
- Export chart
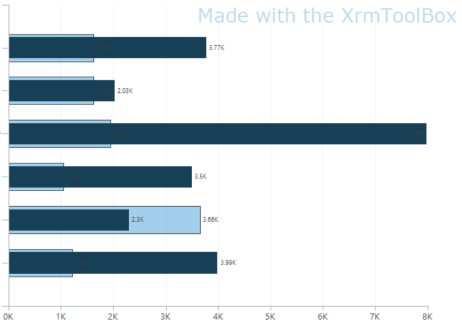
Here an example that represent a Chart generated thanks to this tool. Credit goes to the CrmChartGuy (link below).
Links

Comments
Open Visual Editor Button Not Displaying
I do not see the Open Visual Editor Button. I'm trying to modify the chart colors. Any ideas?
Using the version 1.2018…
Using the version 1.2018.1014.2 of the tool, the button becomes visible when selecting a chart and click on button "Edit Chart" on the top.
The "Edit Chart" button will display a pop-up and on the left bottom, the buttons "Open Visual Editor" and "Preview" are visible.
The version is visible in the main page, where all tools are displayed.