This trick presents a very nice tool to debug the Command Bar in Dynamics 365: the "Command Checker".
Note that this tool is only applicable in the UUI and not to the legacy Web Client interface.
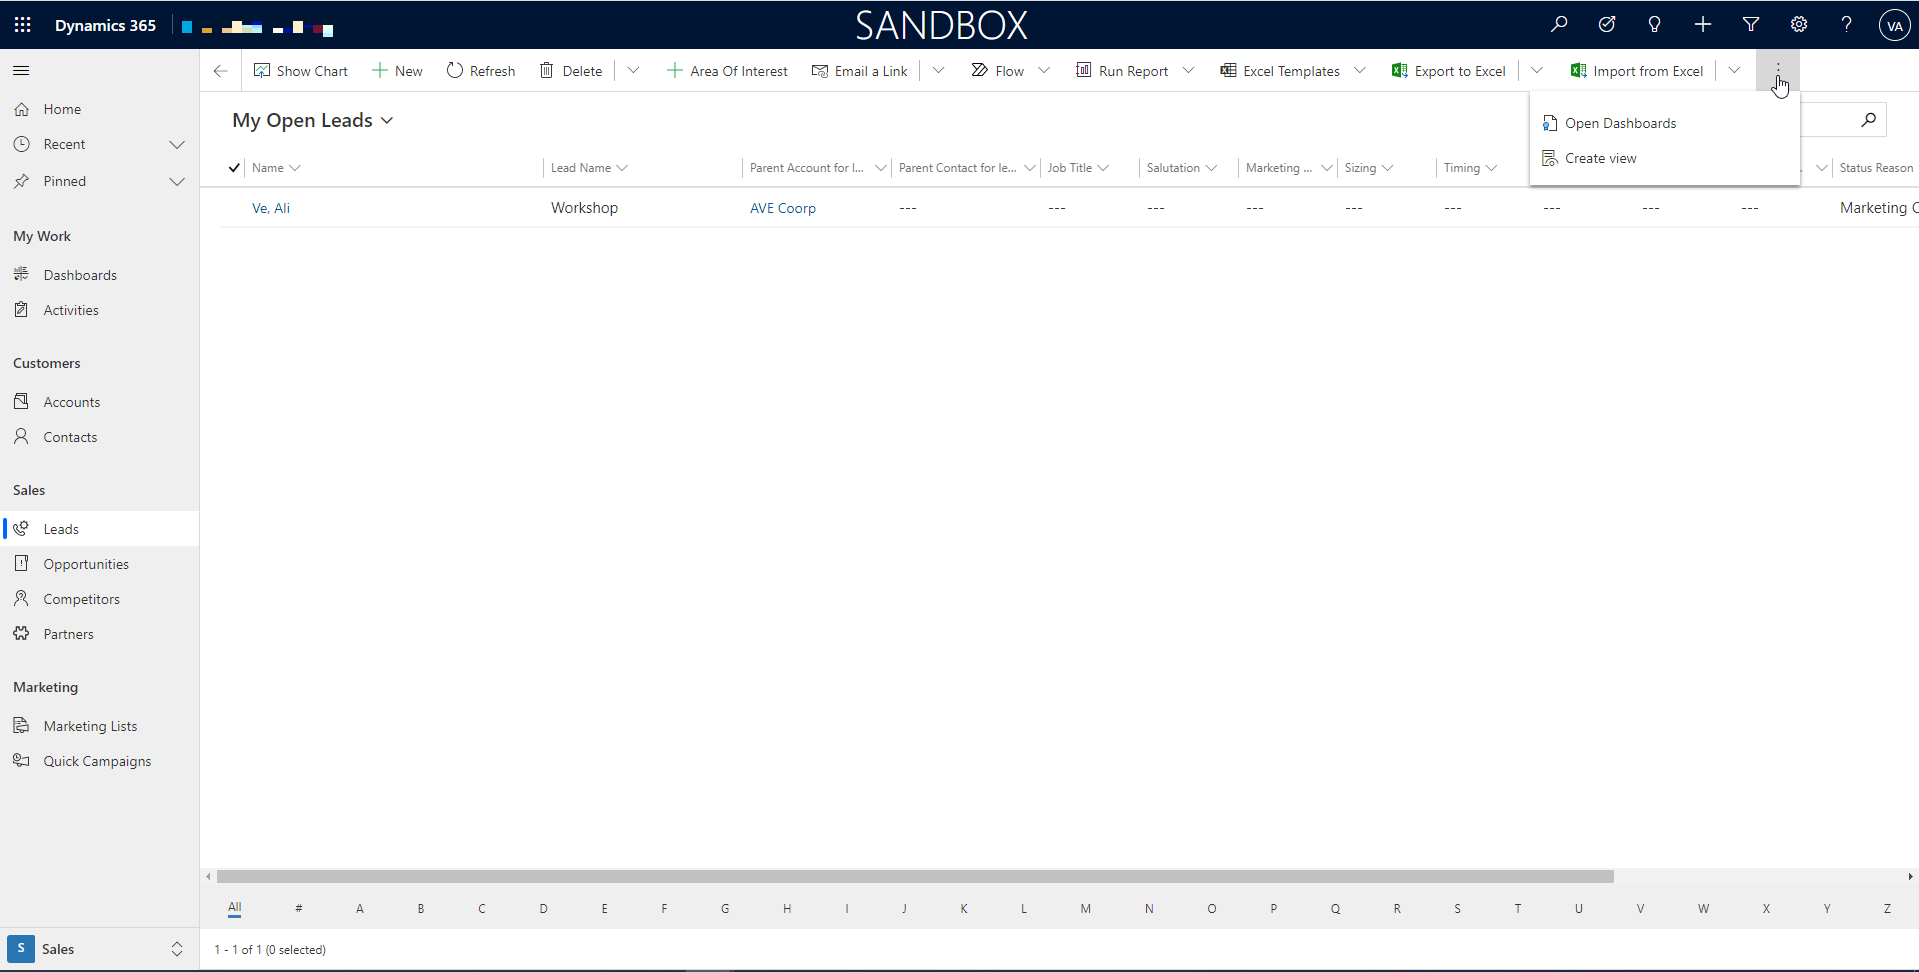
Here is the appearance of the CRM without the tool enabled:

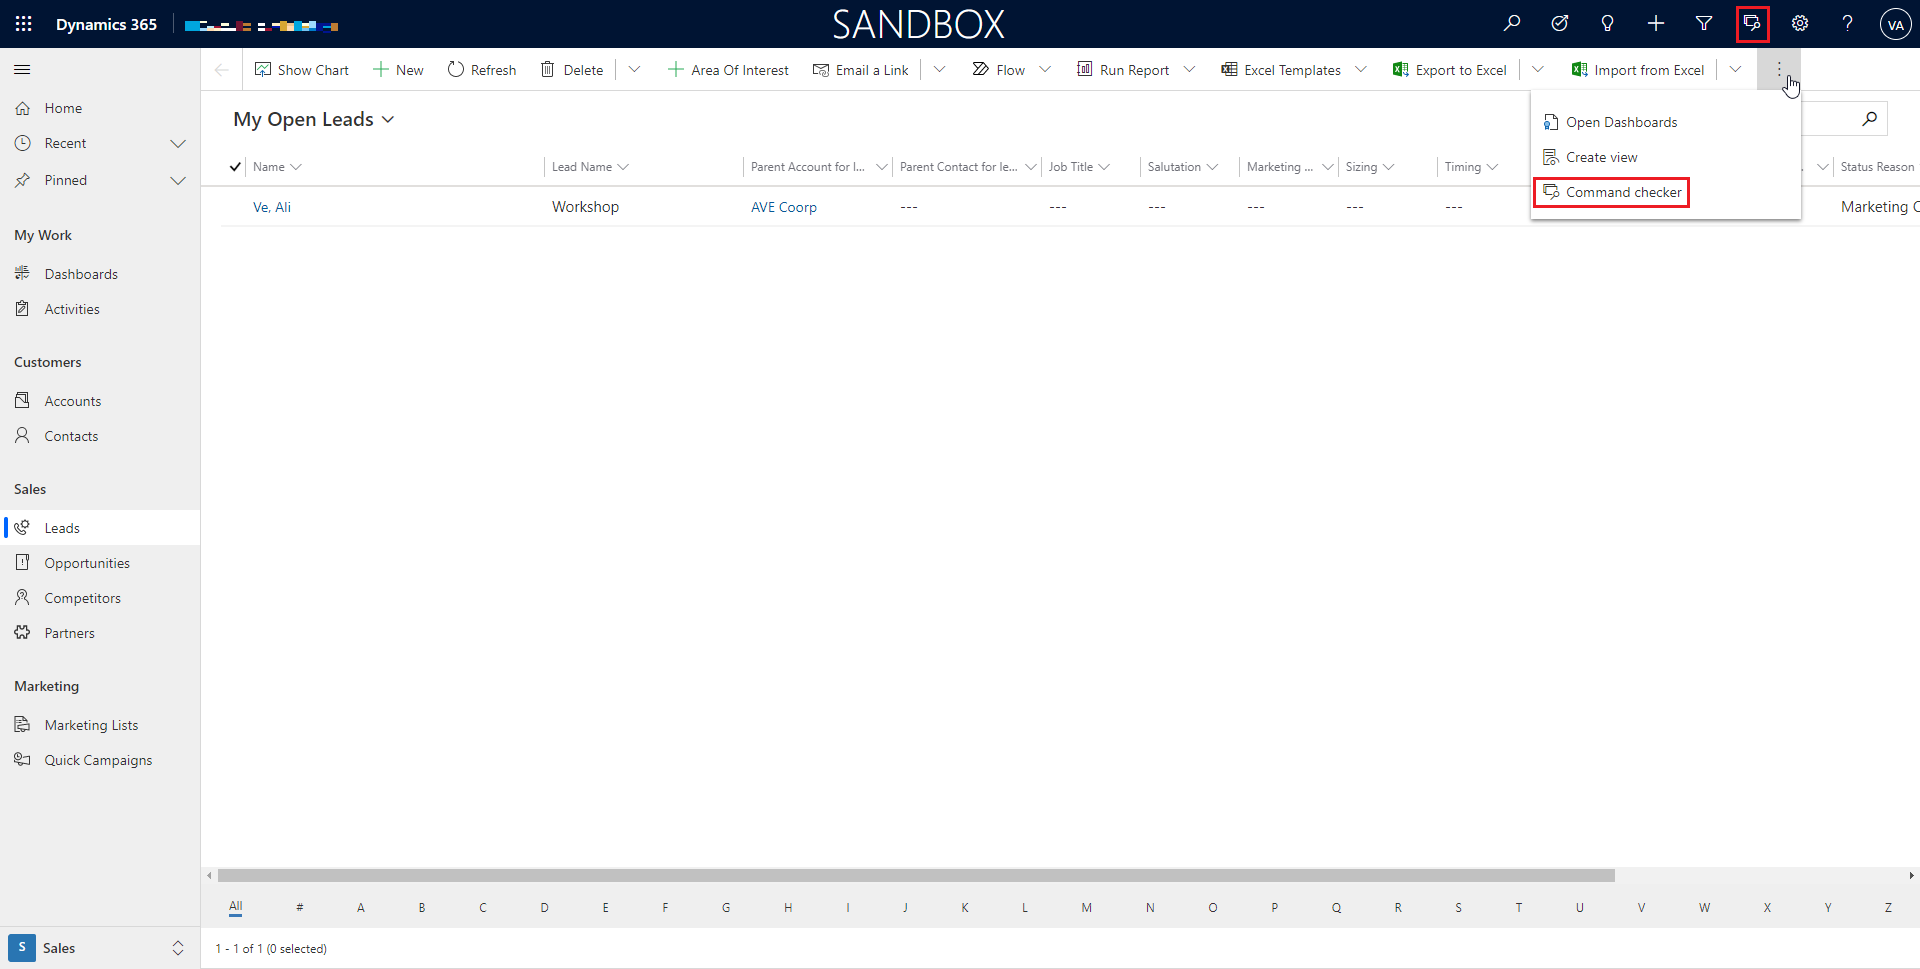
To enable the tool, add ribbondebug=true in your URL:

This makes new buttons appear in your CRM: one for the global Command Bar of the CRM, one for the Command Bar of the View, one for the Command Bar of the Form.

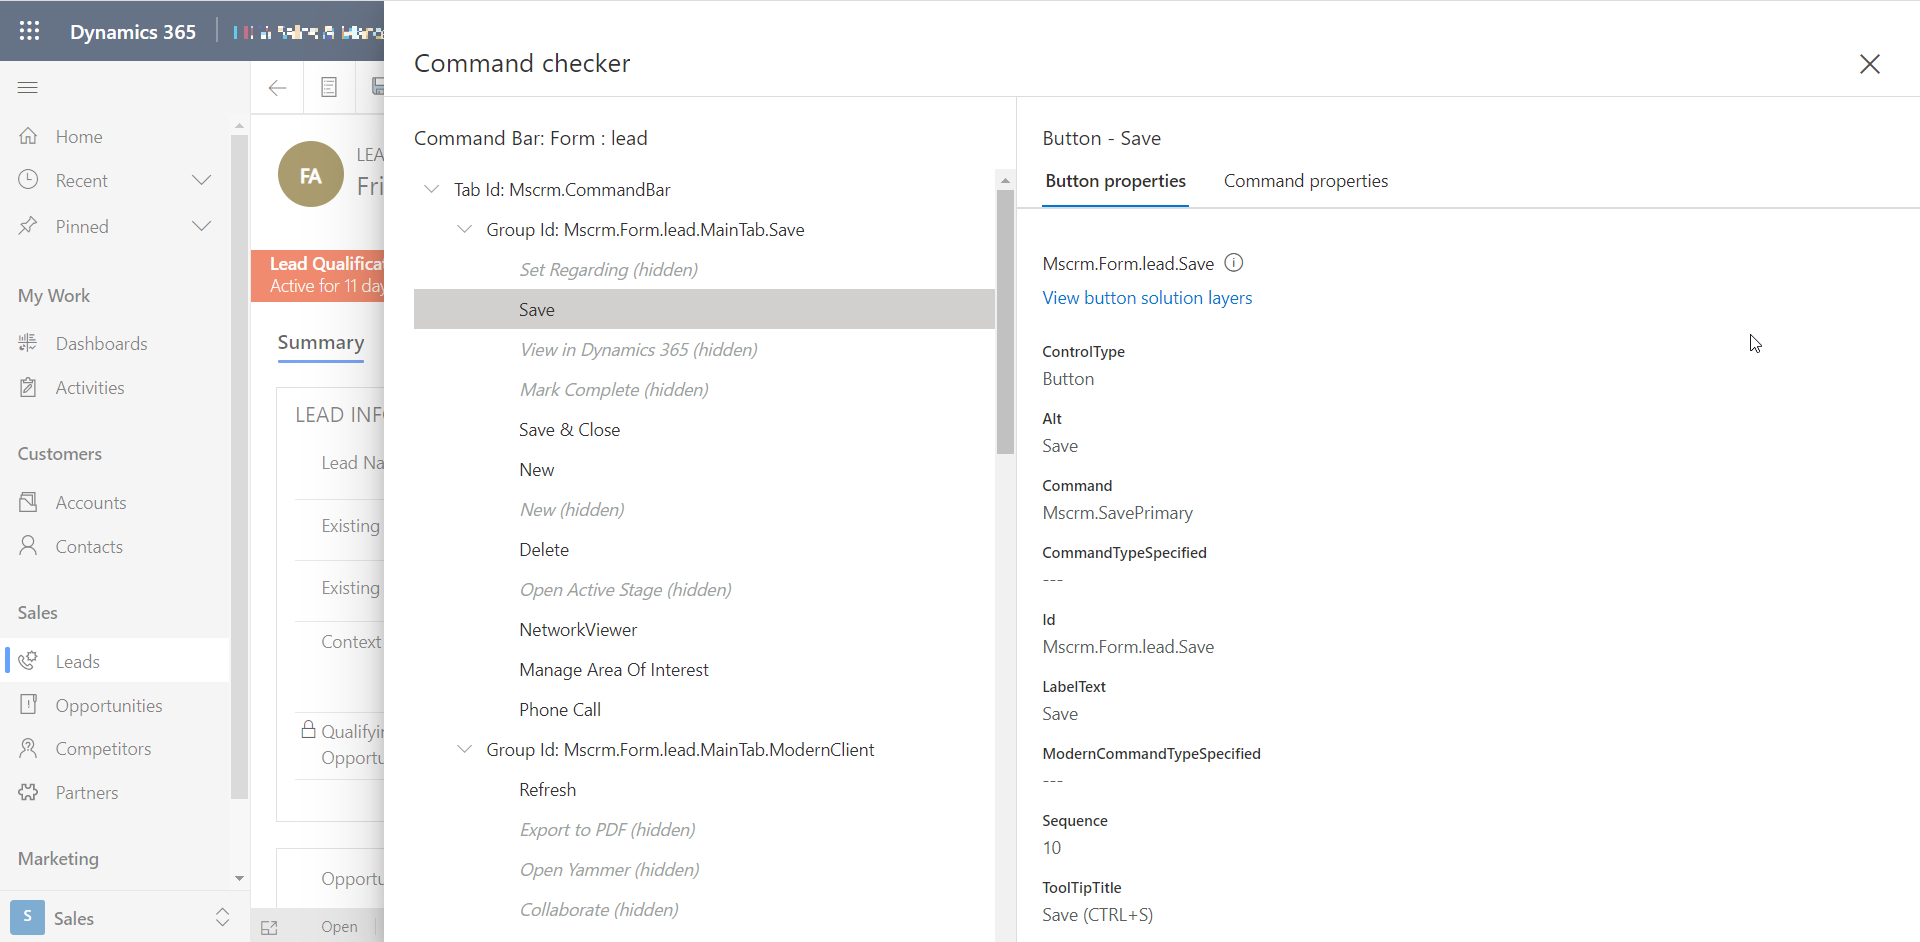
Clicking of on one of these buttons opens the debugging tool. Below is the tool opened for the Form of a Lead:

A similar window opens if you click on the button for the global Command Bar, or the Command Bar for View.
On the left, you can see the list of groups and buttons on your Command Bar. It shows if buttons are hidden or not.You can select a button to display information about it.
On the right you see the Properties of your button. For instance the type, the name, the Id...
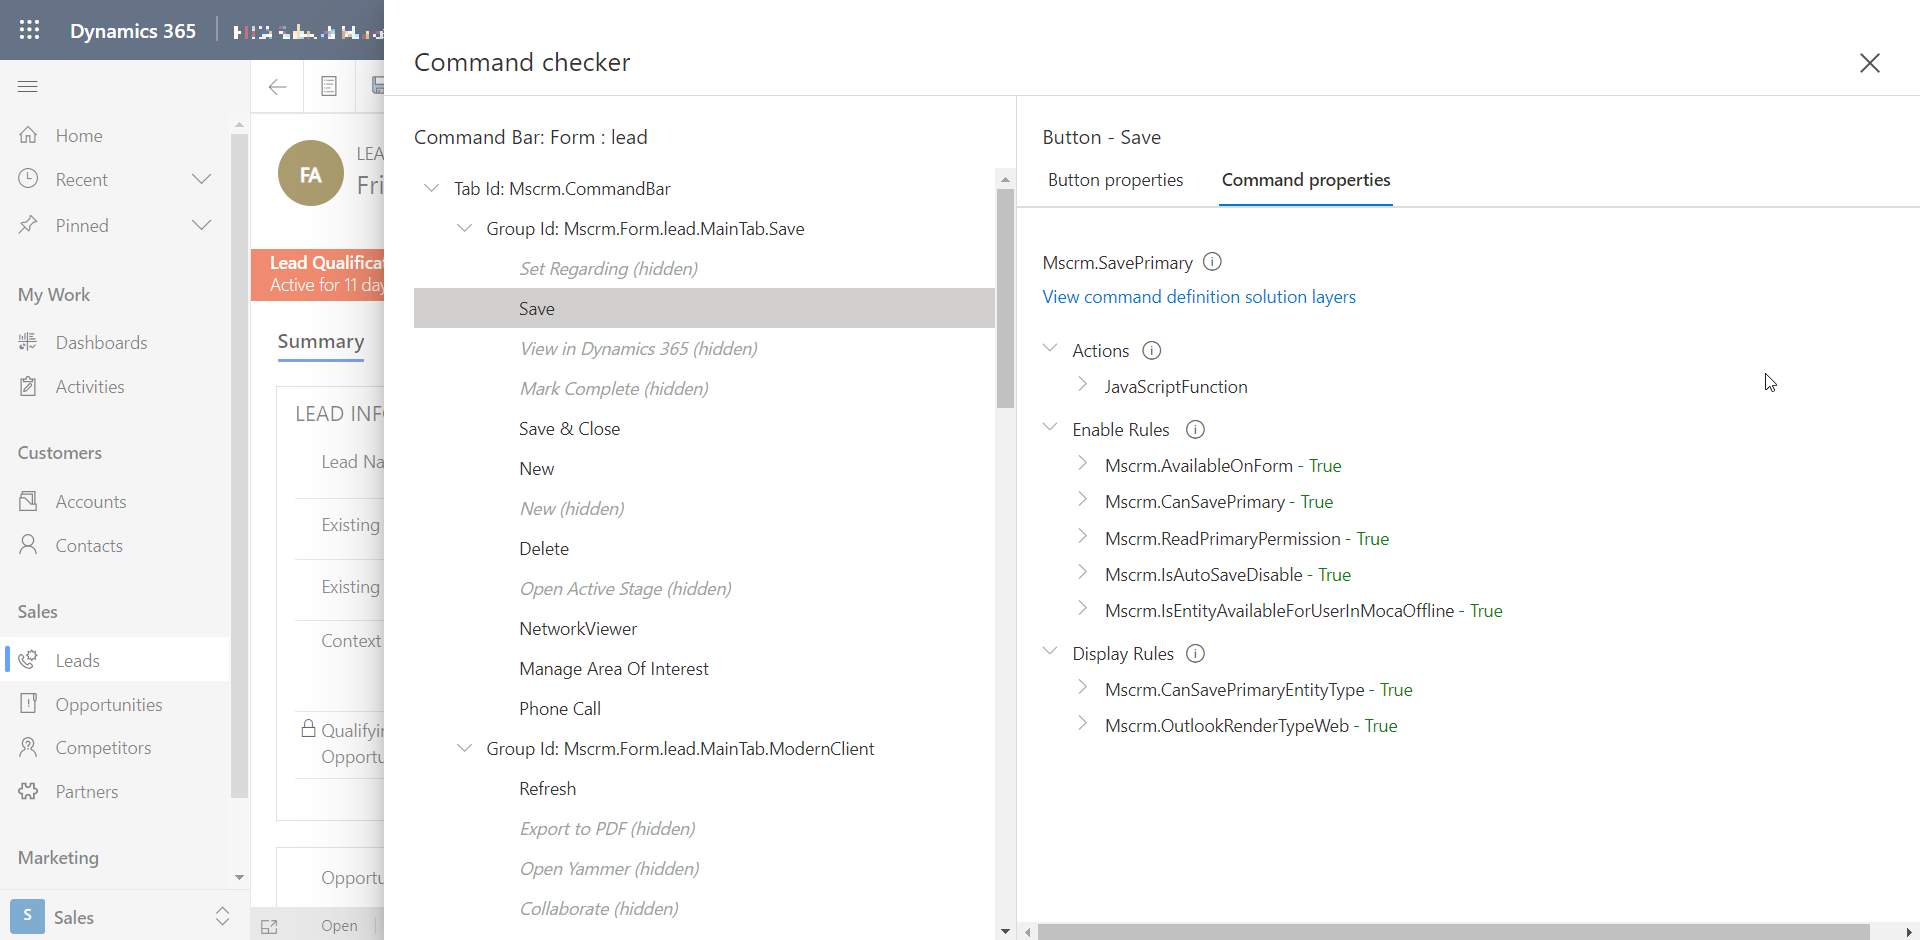
You can click on another tab called "Command Properties":

This tab shows the Actions called by the button, the Enables Rules and the Display Rules.
It is a quick way to visualise the behaviour of a button.
One of the most interesting features is that the result of the rules are displayed alongside: true, false or skipped.
For instance, if all Enable Rules evaluate to true, the button will be enabled. If one of them evaluate to false, the button would be disabled. This is a very nice way to see which rule might not behave as you expected!
Hope you will enjoy this tool as mush as we do !

